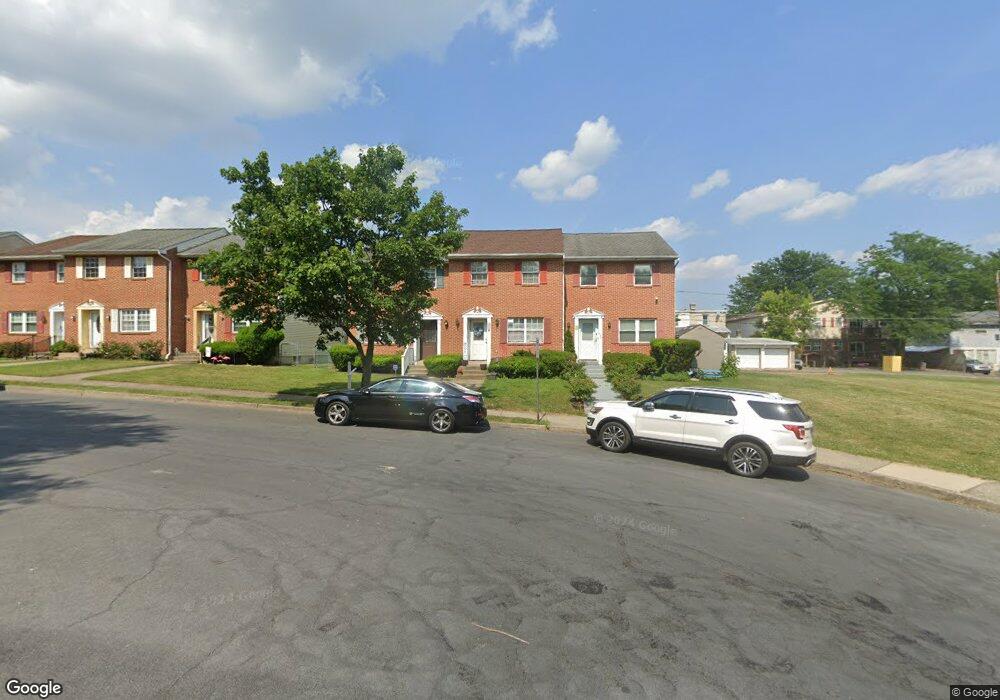
431 S Saint George St Allentown, PA 18104
West End Allentown NeighborhoodEstimated Value: $223,775 - $238,000
3
Beds
2
Baths
1,080
Sq Ft
$213/Sq Ft
Est. Value
About This Home
This home is located at 431 S Saint George St, Allentown, PA 18104 and is currently estimated at $230,444, approximately $213 per square foot. 431 S Saint George St is a home located in Lehigh County with nearby schools including Huntington Elementary School, Cleveland School, and Union Terrace Elementary School.
Ownership History
Date
Name
Owned For
Owner Type
Purchase Details
Closed on
Apr 19, 2021
Sold by
Deschamps Nidia
Bought by
Rouse Karissa
Current Estimated Value
Home Financials for this Owner
Home Financials are based on the most recent Mortgage that was taken out on this home.
Original Mortgage
$147,283
Outstanding Balance
$132,979
Interest Rate
3%
Mortgage Type
FHA
Estimated Equity
$97,465
Purchase Details
Closed on
Oct 1, 2007
Sold by
Major Rebecca Godfrey
Bought by
Deschamps Nidia
Home Financials for this Owner
Home Financials are based on the most recent Mortgage that was taken out on this home.
Original Mortgage
$149,900
Interest Rate
6.49%
Mortgage Type
New Conventional
Purchase Details
Closed on
Apr 30, 2001
Sold by
Heidecker Enterprises Inc
Bought by
Major Rebecca Godfrey
Purchase Details
Closed on
Nov 30, 1990
Sold by
Loch Bruce C
Bought by
Heidecker Enterprises Inc
Purchase Details
Closed on
Aug 14, 1985
Sold by
Loch Bruce C
Bought by
Loch Bruce C
Purchase Details
Closed on
Feb 8, 1984
Bought by
Loch Bruce C
Create a Home Valuation Report for This Property
The Home Valuation Report is an in-depth analysis detailing your home's value as well as a comparison with similar homes in the area
Home Values in the Area
Average Home Value in this Area
Purchase History
| Date | Buyer | Sale Price | Title Company |
|---|---|---|---|
| Rouse Karissa | $150,000 | None Available | |
| Deschamps Nidia | $149,900 | -- | |
| Major Rebecca Godfrey | $75,000 | -- | |
| Heidecker Enterprises Inc | $679,200 | -- | |
| Loch Bruce C | $1,500,000 | -- | |
| Loch Bruce C | $50,000 | -- |
Source: Public Records
Mortgage History
| Date | Status | Borrower | Loan Amount |
|---|---|---|---|
| Open | Rouse Karissa | $147,283 | |
| Previous Owner | Deschamps Nidia | $149,900 |
Source: Public Records
Tax History Compared to Growth
Tax History
| Year | Tax Paid | Tax Assessment Tax Assessment Total Assessment is a certain percentage of the fair market value that is determined by local assessors to be the total taxable value of land and additions on the property. | Land | Improvement |
|---|---|---|---|---|
| 2025 | $2,795 | $86,000 | $7,300 | $78,700 |
| 2024 | $2,795 | $86,000 | $7,300 | $78,700 |
| 2023 | $2,795 | $86,000 | $7,300 | $78,700 |
| 2022 | $2,697 | $86,000 | $78,700 | $7,300 |
| 2021 | $2,643 | $86,000 | $7,300 | $78,700 |
| 2020 | $2,574 | $86,000 | $7,300 | $78,700 |
| 2019 | $2,532 | $86,000 | $7,300 | $78,700 |
| 2018 | $2,363 | $86,000 | $7,300 | $78,700 |
| 2017 | $2,303 | $86,000 | $7,300 | $78,700 |
| 2016 | -- | $86,000 | $7,300 | $78,700 |
| 2015 | -- | $86,000 | $7,300 | $78,700 |
| 2014 | -- | $86,000 | $7,300 | $78,700 |
Source: Public Records
Map
Nearby Homes
- 406 S 17th St
- 129 S Saint Cloud St
- 128 S West St
- 304 S Fulton St
- 127 S 16th St
- 39 S 17th St
- 871 Robin Hood Dr
- 232 S Franklin St
- 320 S 22nd St
- 134 S Franklin St
- 1830 Sherwood Rd
- 119 S 14th St
- 2317-2319 Elm St
- 1845 Lehigh Pkwy N
- 216 S 13th St
- 2270 Bishop Rd
- 1331 W Maple St
- 215 N 19th St
- 1420 W Linden St
- 1605 W Turner St
- 433 S Saint George St
- 429 S Saint George St
- 425 S Saint George St
- 423 S Saint George St
- 421 S Saint George St
- 417 S Saint George St
- 432 S 18th St
- 430 S 18th St
- 434 S 18th St
- 428 S 18th St
- 415 S Saint George St
- 436 S 18th St
- 426 S 18th St
- 438 S 18th St
- 424 S 18th St
- 440 S 18th St
- 413 S Saint George St
- 422 S 18th St
- 440 S Saint George St
- 420 S 18th St