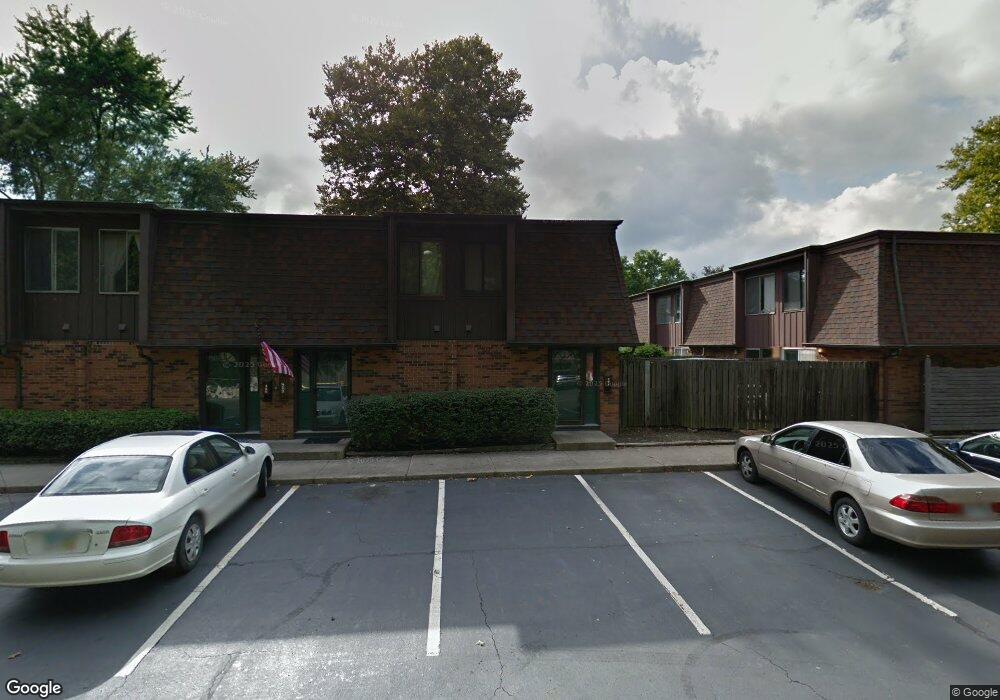
431 Shell Ct E Unit J431 Columbus, OH 43213
Estimated Value: $123,000 - $153,000
2
Beds
2
Baths
952
Sq Ft
$146/Sq Ft
Est. Value
About This Home
This home is located at 431 Shell Ct E Unit J431, Columbus, OH 43213 and is currently estimated at $139,039, approximately $146 per square foot. 431 Shell Ct E Unit J431 is a home located in Franklin County with nearby schools including Etna Road Elementary School, Beechwood Elementary School, and Rosemore Middle School.
Ownership History
Date
Name
Owned For
Owner Type
Purchase Details
Closed on
Dec 27, 2021
Sold by
Tadesse Enanu and Dires Abeje
Bought by
Mengesha Meseret B
Current Estimated Value
Home Financials for this Owner
Home Financials are based on the most recent Mortgage that was taken out on this home.
Original Mortgage
$80,510
Outstanding Balance
$73,600
Interest Rate
3.12%
Mortgage Type
New Conventional
Estimated Equity
$65,439
Purchase Details
Closed on
Mar 19, 2020
Sold by
Areda Getachen
Bought by
Tadesse Enanu and Dires Abeje
Purchase Details
Closed on
May 22, 2019
Sold by
Rinehart Adam R and The Frank And Virginia Bova Tr
Bought by
Areda Getachen
Purchase Details
Closed on
Mar 27, 2005
Sold by
Bova Virginia
Bought by
Harrington Jacquelyn R and Virginia Bova Trust Agreement
Purchase Details
Closed on
Nov 17, 1997
Sold by
Russo Nancy A and Russo Arthur F
Bought by
Heilman Thomas P
Purchase Details
Closed on
Jun 2, 1989
Create a Home Valuation Report for This Property
The Home Valuation Report is an in-depth analysis detailing your home's value as well as a comparison with similar homes in the area
Home Values in the Area
Average Home Value in this Area
Purchase History
| Date | Buyer | Sale Price | Title Company |
|---|---|---|---|
| Mengesha Meseret B | $85,000 | Crown Search Services Ltd | |
| Tadesse Enanu | $35,500 | None Available | |
| Areda Getachen | $35,000 | Great American Title Box | |
| Harrington Jacquelyn R | -- | -- | |
| Heilman Thomas P | $20,000 | -- | |
| -- | $32,000 | -- |
Source: Public Records
Mortgage History
| Date | Status | Borrower | Loan Amount |
|---|---|---|---|
| Open | Mengesha Meseret B | $80,510 |
Source: Public Records
Tax History
| Year | Tax Paid | Tax Assessment Tax Assessment Total Assessment is a certain percentage of the fair market value that is determined by local assessors to be the total taxable value of land and additions on the property. | Land | Improvement |
|---|---|---|---|---|
| 2025 | $1,237 | $28,290 | $5,780 | $22,510 |
| 2024 | $1,237 | $28,290 | $5,780 | $22,510 |
| 2023 | $1,228 | $28,280 | $5,775 | $22,505 |
| 2022 | $958 | $16,770 | $1,890 | $14,880 |
| 2021 | $899 | $16,770 | $1,890 | $14,880 |
| 2020 | $890 | $16,770 | $1,890 | $14,880 |
| 2019 | $779 | $12,430 | $1,400 | $11,030 |
| 2018 | $826 | $12,430 | $1,400 | $11,030 |
| 2017 | $827 | $12,430 | $1,400 | $11,030 |
| 2016 | $907 | $11,910 | $2,210 | $9,700 |
| 2015 | $857 | $11,910 | $2,210 | $9,700 |
| 2014 | $807 | $11,910 | $2,210 | $9,700 |
| 2013 | $451 | $14,000 | $2,590 | $11,410 |
Source: Public Records
Map
Nearby Homes
- 413 Shell Ct E Unit K413
- 547 Country Club Rd
- 4517 Saint Rita Ln
- 4662 Jae Ave
- 491 Westphal Ave
- 4623 Langley Ave
- 225 Santa Maria Ln
- 686 Fairway Blvd
- 695 Erickson Ave
- 745 Pierce Ave
- 931 Antwerp Rd
- 4148 Elbern Ave
- 746 S Yearling Rd
- 4117 Elbern Ave
- 798 S Yearling Rd
- 1085 S Hamilton Rd
- 4174 Wright Park
- 110 Ironclad Dr Unit 9
- 963 Erickson Ave
- 4991 Justin Rd
- 433 Shell Ct E
- 435 Shell Ct E
- 437 Shell Ct E
- 439 Shell Ct E
- 427 Shell Ct E
- 425 Shell Ct E
- 425 Shell Ct E Unit 425 Building K
- 429 Shell Ct E
- 421 Shell Ct E
- 423 Shell Ct E Unit K423
- 441 Shell Ct E
- 419 Shell Ct E
- 443 Shell Ct E Unit J443
- 415 Shell Ct E Unit K415
- 417 Shell Ct E
- 445 Shell Ct E
- 455 Shell Ct E Unit I455
- 457 Shell Ct E Unit 457
- 451 Shell Ct E Unit 1
- 447 Shell Ct E Unit J447
Your Personal Tour Guide
Ask me questions while you tour the home.