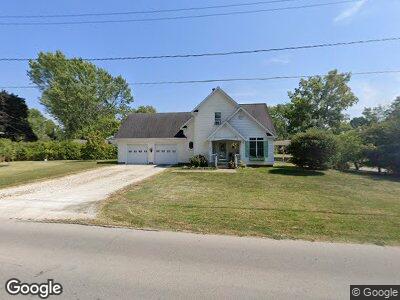
431 Sycamore St Tiffin, OH 44883
Estimated Value: $208,000 - $317,000
3
Beds
1
Bath
2,156
Sq Ft
$112/Sq Ft
Est. Value
About This Home
This home is located at 431 Sycamore St, Tiffin, OH 44883 and is currently estimated at $241,484, approximately $112 per square foot. 431 Sycamore St is a home located in Seneca County with nearby schools including Columbian High School, Bridges Community Academy, and Calvert High School.
Ownership History
Date
Name
Owned For
Owner Type
Purchase Details
Closed on
Feb 27, 1998
Sold by
Mccabe Kathryn A
Bought by
Nutter Charles J
Current Estimated Value
Purchase Details
Closed on
Feb 13, 1998
Sold by
Mccabe Ralph F
Bought by
Mccabe Kathryn A
Create a Home Valuation Report for This Property
The Home Valuation Report is an in-depth analysis detailing your home's value as well as a comparison with similar homes in the area
Home Values in the Area
Average Home Value in this Area
Purchase History
| Date | Buyer | Sale Price | Title Company |
|---|---|---|---|
| Nutter Charles J | $70,000 | -- | |
| Mccabe Kathryn A | -- | -- |
Source: Public Records
Mortgage History
| Date | Status | Borrower | Loan Amount |
|---|---|---|---|
| Closed | Nutter Charles J | $37,000 |
Source: Public Records
Tax History Compared to Growth
Tax History
| Year | Tax Paid | Tax Assessment Tax Assessment Total Assessment is a certain percentage of the fair market value that is determined by local assessors to be the total taxable value of land and additions on the property. | Land | Improvement |
|---|---|---|---|---|
| 2024 | $2,048 | $60,600 | $12,530 | $48,070 |
| 2023 | $2,048 | $60,600 | $12,530 | $48,070 |
| 2022 | $1,902 | $46,700 | $11,790 | $34,910 |
| 2021 | $1,916 | $46,700 | $11,790 | $34,910 |
| 2020 | $1,952 | $46,697 | $11,788 | $34,909 |
| 2019 | $1,753 | $40,562 | $10,444 | $30,118 |
| 2018 | $1,756 | $40,562 | $10,444 | $30,118 |
| 2017 | $1,712 | $40,562 | $10,444 | $30,118 |
| 2016 | $1,667 | $39,060 | $10,234 | $28,826 |
| 2015 | $1,648 | $39,060 | $10,234 | $28,826 |
| 2014 | $1,553 | $39,060 | $10,234 | $28,826 |
| 2013 | $1,643 | $39,834 | $10,444 | $29,390 |
Source: Public Records
Map
Nearby Homes
- 13 Sycamore Woods Ln
- 0 Gibson St
- 54 Harvest Ln
- 178 Gibson Ct
- 180 Gibson Ct
- 378 Lelar St
- 31 Mohawk St
- 26 Saint Francis Ave
- 389 S Monroe St
- 466 Circular St
- 279 S Monroe St
- 235 Front St
- 19 Blue Bird Ln
- 2465 S County Road 19
- 314 S Sandusky St
- 64 Saint Clair St
- 88 Pearl St
- 399 Melmore St
- 291 Circular St
- 9 Main St
- 431 Sycamore St
- 240 Gibson St
- 234 Gibson St
- 405 Sycamore St
- 233 Gibson St
- 412 Sycamore St
- 416 Sycamore St
- 228 Gibson St
- 440 Sycamore St
- 229 Gibson St
- 227 Gibson St
- 226 Gibson St
- 446 Sycamore St
- 10 Hampden Park
- 22 Hampden Park
- 400 Sycamore St
- 218 Gibson St
- 454 Sycamore St
- 102 Autumn Ln
- 30 Hampden Park