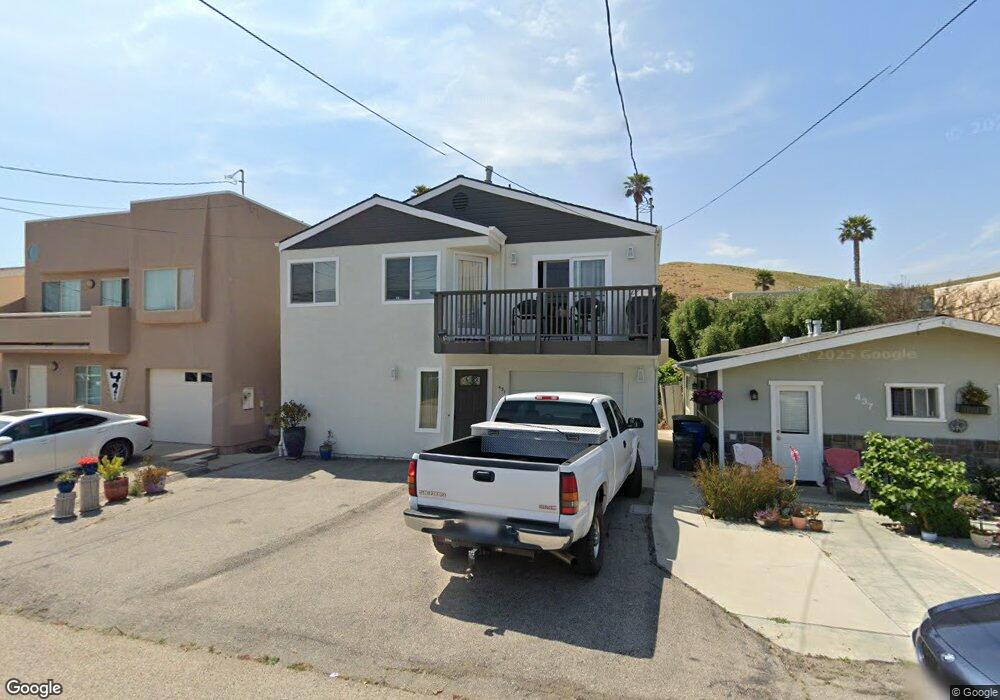
431 Tahiti St Morro Bay, CA 93442
Estimated Value: $726,196 - $834,000
3
Beds
2
Baths
1,100
Sq Ft
$726/Sq Ft
Est. Value
About This Home
This home is located at 431 Tahiti St, Morro Bay, CA 93442 and is currently estimated at $798,549, approximately $725 per square foot. 431 Tahiti St is a home located in San Luis Obispo County with nearby schools including Del Mar Elementary School, Los Osos Middle School, and Morro Bay High School.
Ownership History
Date
Name
Owned For
Owner Type
Purchase Details
Closed on
May 12, 2023
Sold by
Merk David L
Bought by
David L Merk Living Trust
Current Estimated Value
Purchase Details
Closed on
Mar 30, 2010
Sold by
Merk Herbert L and Merk Pauline V
Bought by
Merk David L
Purchase Details
Closed on
Sep 23, 1997
Sold by
Northington H A H and Northington Jan F
Bought by
Merk David L and Merk Herbert L
Home Financials for this Owner
Home Financials are based on the most recent Mortgage that was taken out on this home.
Original Mortgage
$129,600
Interest Rate
7.16%
Purchase Details
Closed on
Mar 27, 1997
Sold by
Carlson L Neal and Carlson Nancy J
Bought by
Northington H A and Northington Jan F
Create a Home Valuation Report for This Property
The Home Valuation Report is an in-depth analysis detailing your home's value as well as a comparison with similar homes in the area
Home Values in the Area
Average Home Value in this Area
Purchase History
| Date | Buyer | Sale Price | Title Company |
|---|---|---|---|
| David L Merk Living Trust | -- | None Listed On Document | |
| Merk David L | -- | None Available | |
| Merk David L | $162,000 | First American Title Ins Co | |
| Northington H A | $41,500 | First American Title Co |
Source: Public Records
Mortgage History
| Date | Status | Borrower | Loan Amount |
|---|---|---|---|
| Previous Owner | Merk David L | $129,600 |
Source: Public Records
Tax History Compared to Growth
Tax History
| Year | Tax Paid | Tax Assessment Tax Assessment Total Assessment is a certain percentage of the fair market value that is determined by local assessors to be the total taxable value of land and additions on the property. | Land | Improvement |
|---|---|---|---|---|
| 2025 | $2,802 | $258,637 | $146,882 | $111,755 |
| 2024 | $2,752 | $253,566 | $144,002 | $109,564 |
| 2023 | $2,752 | $248,595 | $141,179 | $107,416 |
| 2022 | $2,579 | $243,721 | $138,411 | $105,310 |
| 2021 | $2,538 | $238,944 | $135,698 | $103,246 |
| 2020 | $2,512 | $236,495 | $134,307 | $102,188 |
| 2019 | $2,486 | $231,859 | $131,674 | $100,185 |
| 2018 | $2,437 | $227,314 | $129,093 | $98,221 |
| 2017 | $2,390 | $222,858 | $126,562 | $96,296 |
| 2016 | $2,343 | $218,489 | $124,081 | $94,408 |
| 2015 | $2,307 | $215,208 | $122,218 | $92,990 |
| 2014 | $2,118 | $210,993 | $119,824 | $91,169 |
Source: Public Records
Map
Nearby Homes
- 575 Yerba Buena St
- 563 Zanzibar St
- 548 Blanca St
- 536 Blanca St
- 3219 Tide Ave
- 351 Nevis St
- 5010 Cabrillo Hwy
- 165 Damar St
- 160 Damar St
- 3020 Ironwood Ave
- 309 Sequoia St Unit 3
- 670 Sequoia Ct
- 650 Sequoia Ct
- 2931 Hemlock Ave
- 2900 Alder Ave
- 2783 Coral Ave
- 2825 Hemlock Ave
- 679 Elena St
- 2695 Hemlock Ave
- 2675 Juniper Ave
- 421 Tahiti St
- 437 Tahiti St
- 443 Tahiti St
- 411 Tahiti St
- 480 Whidbey Way Unit 15
- 480 Whidbey Way
- 426 Tahiti St
- 472 Whidbey Way
- 474 Whidbey Way
- 449 Tahiti St
- 418 Tahiti St
- 434 Tahiti St
- 401 Tahiti St
- 410 Tahiti St
- 3330 Tide Ave Unit 11
- 444 Tahiti St
- 3334 Tide Ave Unit 9
- 482 Whidbey Way Unit 14
- 478 Whidbey Way
- 482 Whidbey Way