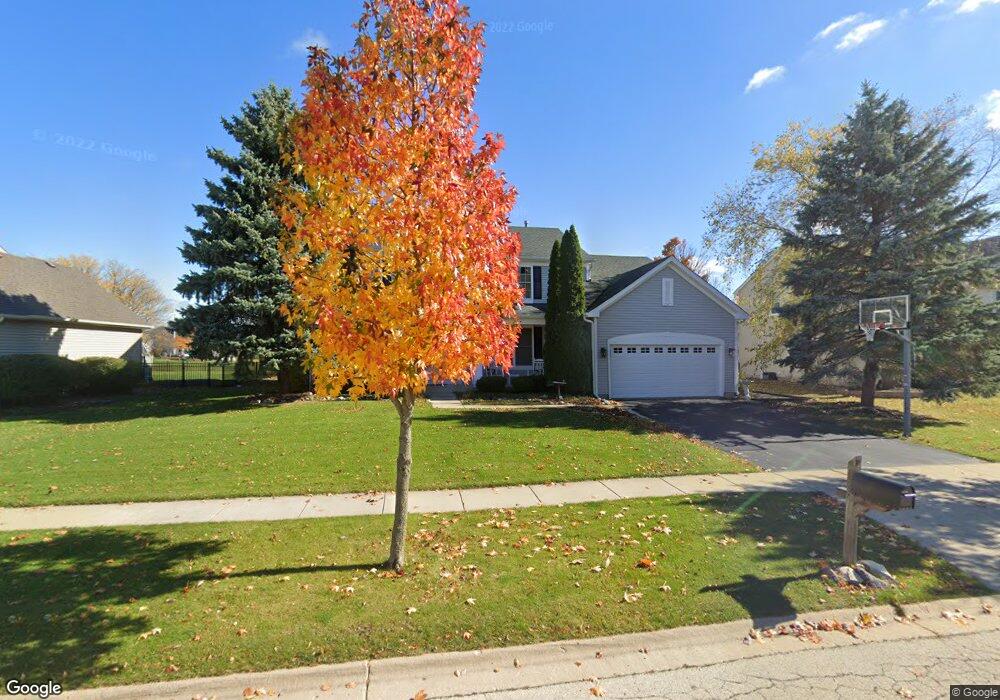
431 Tenby Way Algonquin, IL 60102
Far West Algonquin NeighborhoodEstimated Value: $506,817 - $579,000
4
Beds
3
Baths
3,033
Sq Ft
$179/Sq Ft
Est. Value
About This Home
This home is located at 431 Tenby Way, Algonquin, IL 60102 and is currently estimated at $541,454, approximately $178 per square foot. 431 Tenby Way is a home located in McHenry County with nearby schools including Mackeben Elementary School, Conley Elementary School, and Heineman Middle School.
Ownership History
Date
Name
Owned For
Owner Type
Purchase Details
Closed on
Jun 16, 2006
Sold by
Reiffer Brent C and Reiffer Christina J
Bought by
Raclawski Michael C and Raclawski Maureen A
Current Estimated Value
Home Financials for this Owner
Home Financials are based on the most recent Mortgage that was taken out on this home.
Original Mortgage
$334,750
Outstanding Balance
$198,562
Interest Rate
6.73%
Mortgage Type
Purchase Money Mortgage
Estimated Equity
$342,892
Purchase Details
Closed on
Jul 13, 2005
Sold by
Delap James J and Delap Romona
Bought by
Reiffer Brent C and Reiffer Christina J
Home Financials for this Owner
Home Financials are based on the most recent Mortgage that was taken out on this home.
Original Mortgage
$309,600
Interest Rate
5.66%
Mortgage Type
Fannie Mae Freddie Mac
Purchase Details
Closed on
Aug 27, 1998
Sold by
The Ryland Group Inc
Bought by
Delap James J and Delap Romona
Home Financials for this Owner
Home Financials are based on the most recent Mortgage that was taken out on this home.
Original Mortgage
$204,350
Interest Rate
7.02%
Create a Home Valuation Report for This Property
The Home Valuation Report is an in-depth analysis detailing your home's value as well as a comparison with similar homes in the area
Home Values in the Area
Average Home Value in this Area
Purchase History
| Date | Buyer | Sale Price | Title Company |
|---|---|---|---|
| Raclawski Michael C | $389,750 | None Available | |
| Reiffer Brent C | $387,000 | Republic Title Company | |
| Delap James J | $255,500 | -- |
Source: Public Records
Mortgage History
| Date | Status | Borrower | Loan Amount |
|---|---|---|---|
| Open | Raclawski Michael C | $334,750 | |
| Previous Owner | Reiffer Brent C | $309,600 | |
| Previous Owner | Delap James J | $204,350 |
Source: Public Records
Tax History Compared to Growth
Tax History
| Year | Tax Paid | Tax Assessment Tax Assessment Total Assessment is a certain percentage of the fair market value that is determined by local assessors to be the total taxable value of land and additions on the property. | Land | Improvement |
|---|---|---|---|---|
| 2024 | $10,592 | $151,964 | $18,634 | $133,330 |
| 2023 | $10,288 | $136,511 | $16,739 | $119,772 |
| 2022 | $9,783 | $124,304 | $15,242 | $109,062 |
| 2021 | $9,456 | $117,069 | $14,355 | $102,714 |
| 2020 | $9,316 | $113,947 | $13,972 | $99,975 |
| 2019 | $9,073 | $111,038 | $13,615 | $97,423 |
| 2018 | $10,344 | $122,959 | $15,321 | $107,638 |
| 2017 | $10,232 | $115,879 | $14,439 | $101,440 |
| 2016 | $10,328 | $110,172 | $13,728 | $96,444 |
| 2013 | -- | $99,970 | $16,522 | $83,448 |
Source: Public Records
Map
Nearby Homes
- 4020 Bunker Hill Dr
- 900 Treeline Dr
- 940 Treeline Dr
- 9105 Algonquin Rd
- 3750 Wintergreen Terrace
- 4351 Bunker Hill Dr
- 3520 Bunker Hill Dr
- Rainier Plan at Westview Crossing
- Bryce Plan at Westview Crossing
- Biscayne Plan at Westview Crossing
- Sequoia Plan at Westview Crossing
- Santa Rosa Plan at Westview Crossing
- Adams Plan at Westview Crossing
- 341 Fairway View Dr
- 374 W Point Cir
- 3260 Nottingham Dr
- 16 Springbrook Ln
- 4 Greenbrier Ct
- 3756 Innesbrook Ct
- 4051 Willow View Dr