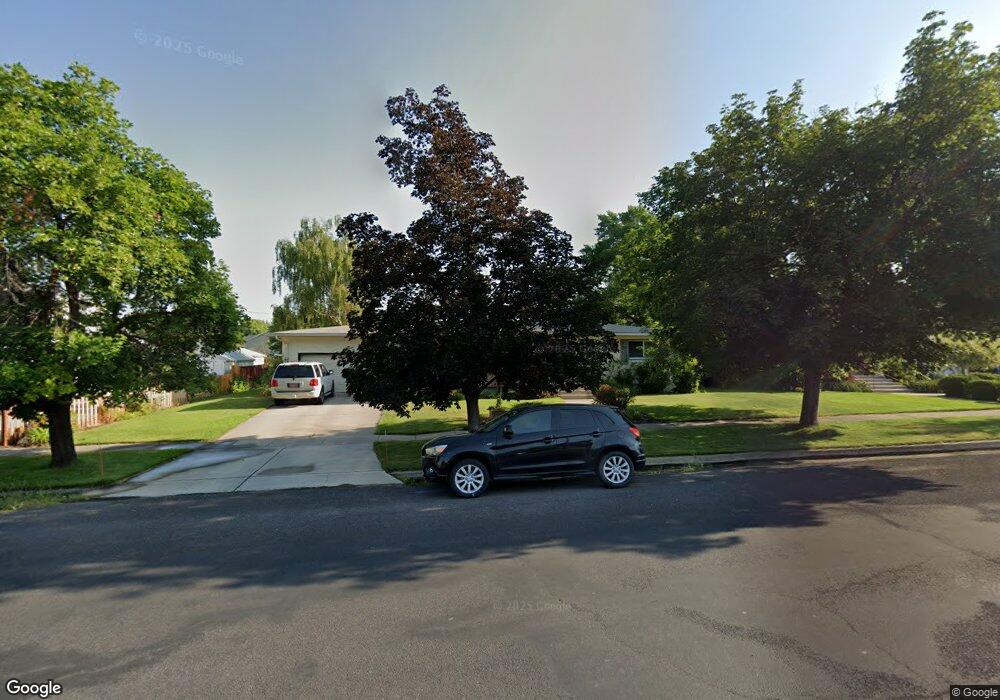
431 W 400 N Logan, UT 84321
Ellis NeighborhoodEstimated Value: $417,000 - $477,890
5
Beds
3
Baths
3,243
Sq Ft
$140/Sq Ft
Est. Value
About This Home
This home is located at 431 W 400 N, Logan, UT 84321 and is currently estimated at $452,973, approximately $139 per square foot. 431 W 400 N is a home located in Cache County with nearby schools including Ellis School, Mount Logan Middle School, and Logan High School.
Ownership History
Date
Name
Owned For
Owner Type
Purchase Details
Closed on
Jun 30, 2025
Sold by
Tuttle Jason and Tuttle Michelle
Bought by
Jason Tuttle And Michelle Tuttle Revocable Tr and Tuttle
Current Estimated Value
Purchase Details
Closed on
Sep 17, 2020
Sold by
Sorensen Eric A
Bought by
Tuttle Jason and Tuttle Michelle
Home Financials for this Owner
Home Financials are based on the most recent Mortgage that was taken out on this home.
Original Mortgage
$250,356
Interest Rate
2.9%
Mortgage Type
VA
Purchase Details
Closed on
Apr 3, 2019
Sold by
10Minginger Llc
Bought by
Sorensen Eric A
Purchase Details
Closed on
Mar 7, 2019
Sold by
431 W 400 N Llc
Bought by
10Minginger Llc
Purchase Details
Closed on
Oct 27, 2005
Sold by
Heninger Mary Jane
Bought by
Heninger Mary Jane and Mary Jane Jeninger Inter Vivos Trust
Create a Home Valuation Report for This Property
The Home Valuation Report is an in-depth analysis detailing your home's value as well as a comparison with similar homes in the area
Home Values in the Area
Average Home Value in this Area
Purchase History
| Date | Buyer | Sale Price | Title Company |
|---|---|---|---|
| Jason Tuttle And Michelle Tuttle Revocable Tr | -- | None Listed On Document | |
| Tuttle Jason | -- | Pinnacle Title | |
| Sorensen Eric A | -- | Accommodation | |
| 10Minginger Llc | -- | Pinnacle Title | |
| 431 W 400 N Llc | -- | Pinnacle Title | |
| Heninger Mary Jane | -- | None Available |
Source: Public Records
Mortgage History
| Date | Status | Borrower | Loan Amount |
|---|---|---|---|
| Previous Owner | Tuttle Jason | $250,356 |
Source: Public Records
Tax History Compared to Growth
Tax History
| Year | Tax Paid | Tax Assessment Tax Assessment Total Assessment is a certain percentage of the fair market value that is determined by local assessors to be the total taxable value of land and additions on the property. | Land | Improvement |
|---|---|---|---|---|
| 2025 | $2,030 | $262,570 | $0 | $0 |
| 2024 | $210 | $262,570 | $0 | $0 |
| 2023 | $2,190 | $261,515 | $0 | $0 |
| 2022 | $2,346 | $261,515 | $0 | $0 |
| 2021 | $1,887 | $325,100 | $44,000 | $281,100 |
| 2020 | $2,923 | $249,200 | $44,000 | $205,200 |
| 2019 | $1,680 | $249,200 | $44,000 | $205,200 |
| 2018 | $1,412 | $191,168 | $44,000 | $147,168 |
| 2017 | $1,347 | $96,470 | $0 | $0 |
| 2016 | $1,397 | $90,970 | $0 | $0 |
| 2015 | $1,319 | $90,970 | $0 | $0 |
| 2014 | $1,192 | $90,970 | $0 | $0 |
| 2013 | -- | $85,285 | $0 | $0 |
Source: Public Records
Map
Nearby Homes