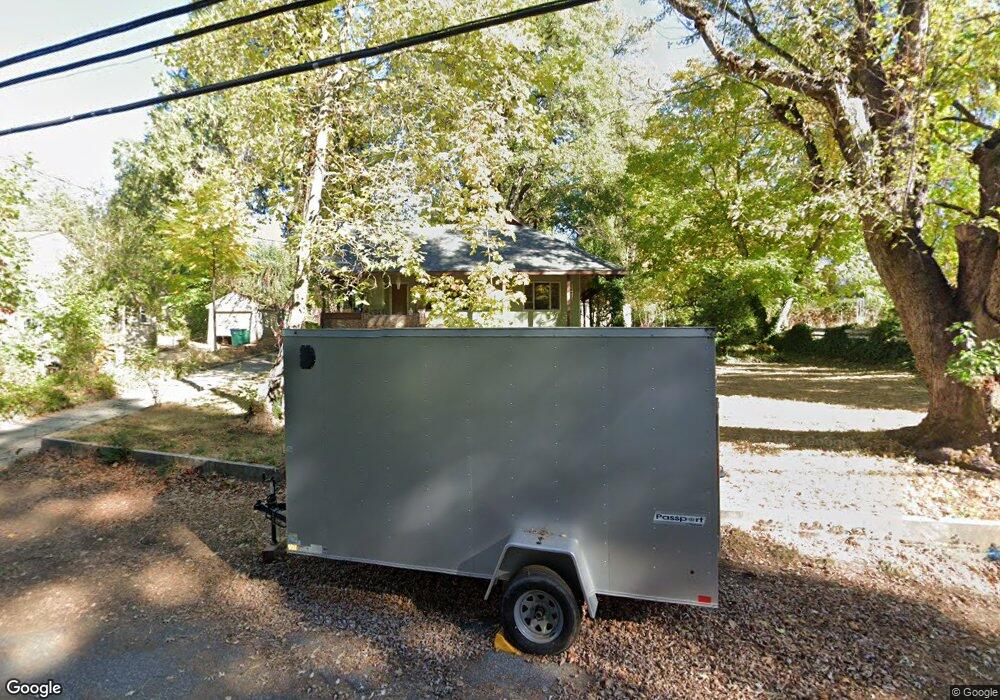
431 Zion St Nevada City, CA 95959
Estimated Value: $671,000 - $800,000
3
Beds
1
Bath
1,800
Sq Ft
$399/Sq Ft
Est. Value
About This Home
This home is located at 431 Zion St, Nevada City, CA 95959 and is currently estimated at $717,753, approximately $398 per square foot. 431 Zion St is a home located in Nevada County with nearby schools including Deer Creek Elementary School, Seven Hills Intermediate School, and Forest Charter School.
Ownership History
Date
Name
Owned For
Owner Type
Purchase Details
Closed on
Sep 28, 2020
Sold by
Genova Christine
Bought by
Porter Luke T
Current Estimated Value
Home Financials for this Owner
Home Financials are based on the most recent Mortgage that was taken out on this home.
Original Mortgage
$389,350
Outstanding Balance
$345,675
Interest Rate
2.8%
Mortgage Type
New Conventional
Estimated Equity
$372,078
Purchase Details
Closed on
Oct 1, 2010
Sold by
Barnhart William and Barnhart Family Revocable Trus
Bought by
Genova Christine
Home Financials for this Owner
Home Financials are based on the most recent Mortgage that was taken out on this home.
Original Mortgage
$272,000
Interest Rate
4.35%
Mortgage Type
Purchase Money Mortgage
Purchase Details
Closed on
Aug 3, 2004
Sold by
Barnhart William
Bought by
Barnhart William and The Barnhart Family Revocable
Create a Home Valuation Report for This Property
The Home Valuation Report is an in-depth analysis detailing your home's value as well as a comparison with similar homes in the area
Home Values in the Area
Average Home Value in this Area
Purchase History
| Date | Buyer | Sale Price | Title Company |
|---|---|---|---|
| Porter Luke T | -- | Old Republic Title Company | |
| Genova Christine | $275,000 | Placer Title Company | |
| Genova Christine | -- | Placer Title Company | |
| Barnhart William | -- | -- |
Source: Public Records
Mortgage History
| Date | Status | Borrower | Loan Amount |
|---|---|---|---|
| Open | Porter Luke T | $389,350 | |
| Previous Owner | Genova Christine | $272,000 |
Source: Public Records
Tax History Compared to Growth
Tax History
| Year | Tax Paid | Tax Assessment Tax Assessment Total Assessment is a certain percentage of the fair market value that is determined by local assessors to be the total taxable value of land and additions on the property. | Land | Improvement |
|---|---|---|---|---|
| 2025 | $3,751 | $358,717 | $172,952 | $185,765 |
| 2024 | $3,683 | $351,684 | $169,561 | $182,123 |
| 2023 | $3,683 | $344,789 | $166,237 | $178,552 |
| 2022 | $6,695 | $338,029 | $162,978 | $175,051 |
| 2021 | $3,513 | $331,402 | $159,783 | $171,619 |
| 2020 | $3,435 | $328,005 | $158,145 | $169,860 |
| 2019 | $3,365 | $321,575 | $155,045 | $166,530 |
| 2018 | $0 | $315,270 | $152,005 | $163,265 |
| 2017 | $3,237 | $309,089 | $149,025 | $160,064 |
| 2016 | $3,118 | $303,029 | $146,103 | $156,926 |
| 2015 | $3,074 | $298,478 | $143,909 | $154,569 |
| 2014 | $3,074 | $292,633 | $141,091 | $151,542 |
Source: Public Records
Map
Nearby Homes