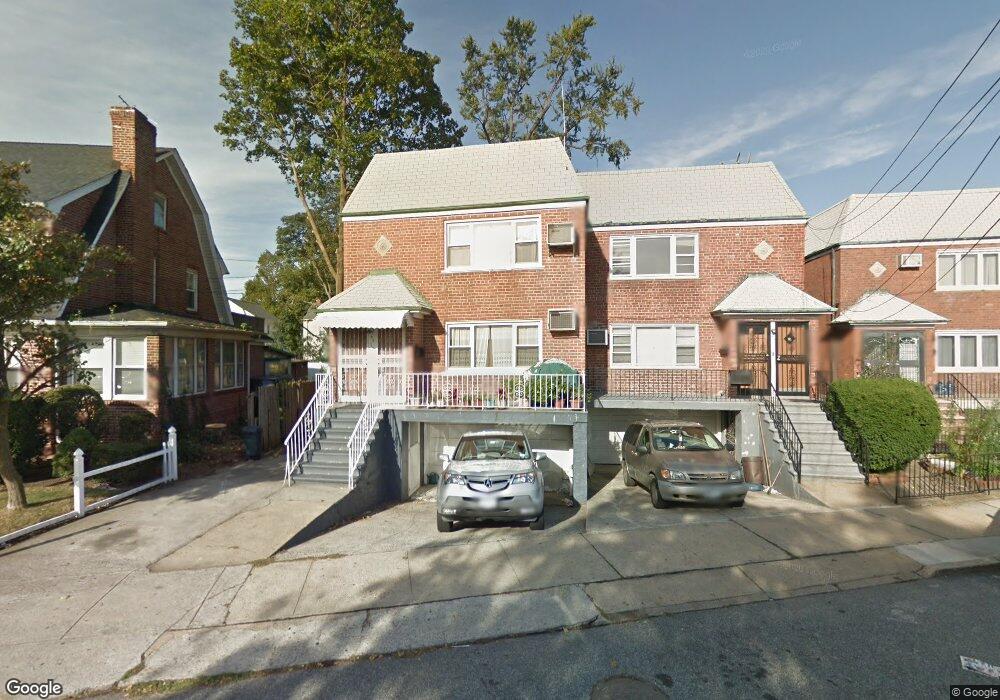
4310 Auburndale Ln Flushing, NY 11358
Flushing NeighborhoodEstimated Value: $1,436,239 - $1,770,000
--
Bed
--
Bath
2,750
Sq Ft
$593/Sq Ft
Est. Value
About This Home
This home is located at 4310 Auburndale Ln, Flushing, NY 11358 and is currently estimated at $1,631,310, approximately $593 per square foot. 4310 Auburndale Ln is a home located in Queens County with nearby schools including I.S. 25 Adrien Block, Francis Lewis High School, and St. Andrew Avellino Catholic Academy.
Ownership History
Date
Name
Owned For
Owner Type
Purchase Details
Closed on
Nov 27, 2020
Sold by
Kyon Thai-Chang and Kyon Thai-Kang
Bought by
Kyon Brothers Properties Llc
Current Estimated Value
Purchase Details
Closed on
Jun 18, 2010
Sold by
Andriopoulos Louis and Andriopoulos Nicholas
Bought by
Kyon Thai-Chang and Kyon Thai-Kang
Home Financials for this Owner
Home Financials are based on the most recent Mortgage that was taken out on this home.
Original Mortgage
$533,000
Interest Rate
4.98%
Mortgage Type
Purchase Money Mortgage
Purchase Details
Closed on
Oct 27, 2006
Sold by
Andriopoulos Elias and Andriopoulos Louis
Bought by
Andriopoulos Louis and Andriopoulos Nicholas
Create a Home Valuation Report for This Property
The Home Valuation Report is an in-depth analysis detailing your home's value as well as a comparison with similar homes in the area
Home Values in the Area
Average Home Value in this Area
Purchase History
| Date | Buyer | Sale Price | Title Company |
|---|---|---|---|
| Kyon Brothers Properties Llc | -- | -- | |
| Kyon Brothers Properties Llc | -- | -- | |
| Kyon Thai-Chang | $850,000 | -- | |
| Kyon Thai-Chang | $850,000 | -- | |
| Andriopoulos Louis | -- | -- | |
| Andriopoulos Louis | -- | -- |
Source: Public Records
Mortgage History
| Date | Status | Borrower | Loan Amount |
|---|---|---|---|
| Previous Owner | Kyon Thai-Chang | $533,000 | |
| Closed | Andriopoulos Louis | $0 |
Source: Public Records
Tax History Compared to Growth
Tax History
| Year | Tax Paid | Tax Assessment Tax Assessment Total Assessment is a certain percentage of the fair market value that is determined by local assessors to be the total taxable value of land and additions on the property. | Land | Improvement |
|---|---|---|---|---|
| 2025 | $11,993 | $63,293 | $16,997 | $46,296 |
| 2024 | $11,993 | $59,712 | $19,216 | $40,496 |
| 2023 | $11,315 | $56,334 | $15,328 | $41,006 |
| 2022 | $11,246 | $75,840 | $23,460 | $52,380 |
| 2021 | $11,766 | $75,420 | $23,460 | $51,960 |
| 2020 | $11,164 | $81,780 | $23,460 | $58,320 |
| 2019 | $10,409 | $70,020 | $23,460 | $46,560 |
| 2018 | $9,570 | $46,945 | $21,697 | $25,248 |
| 2017 | $9,570 | $46,945 | $20,555 | $26,390 |
| 2016 | $9,314 | $46,945 | $20,555 | $26,390 |
| 2015 | $5,341 | $43,953 | $21,339 | $22,614 |
| 2014 | $5,341 | $41,467 | $23,185 | $18,282 |
Source: Public Records
Map
Nearby Homes
- 4321 172nd St
- 43-60 Auburndale Ln
- 4360 Auburndale Ln
- 188-02 Northern Blvd
- 43-04 169th St
- 43-52 169th St
- 42-25 189th St
- 4116 169th St
- 43-56 168th St
- 45-31 169th St
- 167-22 Northern Blvd
- 190-17 42nd Ave
- 45 24 171st St
- 3641 169th St Unit 2F
- 3639 171st St Unit 26
- 4014 191st St
- 189-23 39th Ave Unit 122
- 4547 166th St
- 4419 192nd St
- 191-08 Station Rd
- 43-08 Auburndale Ln
- 4308 Auburndale Ln
- 4314 Auburndale Ln
- 43-14 Auburndale Ln Unit 1st Fl
- 43-14 Auburndale Ln
- 4304 Auburndale Ln
- 17112 Northern Blvd
- 43-02 Auburndale Ln Unit 1
- 4302 Auburndale Ln
- 43-04 Auburndale Ln
- 4318 Auburndale Ln
- 4319 171st St
- 4315 171st St
- 43-23 171st St
- 4323 171st St
- 4319 171st St
- 4322 Auburndale Ln
- 43-19 171st St
- 17110 Northern Blvd
- 4327 171st St