4310 Avalon Dr San Diego, CA 92103
Mission Hills NeighborhoodEstimated Value: $3,262,658 - $4,362,000
5
Beds
4
Baths
4,000
Sq Ft
$959/Sq Ft
Est. Value
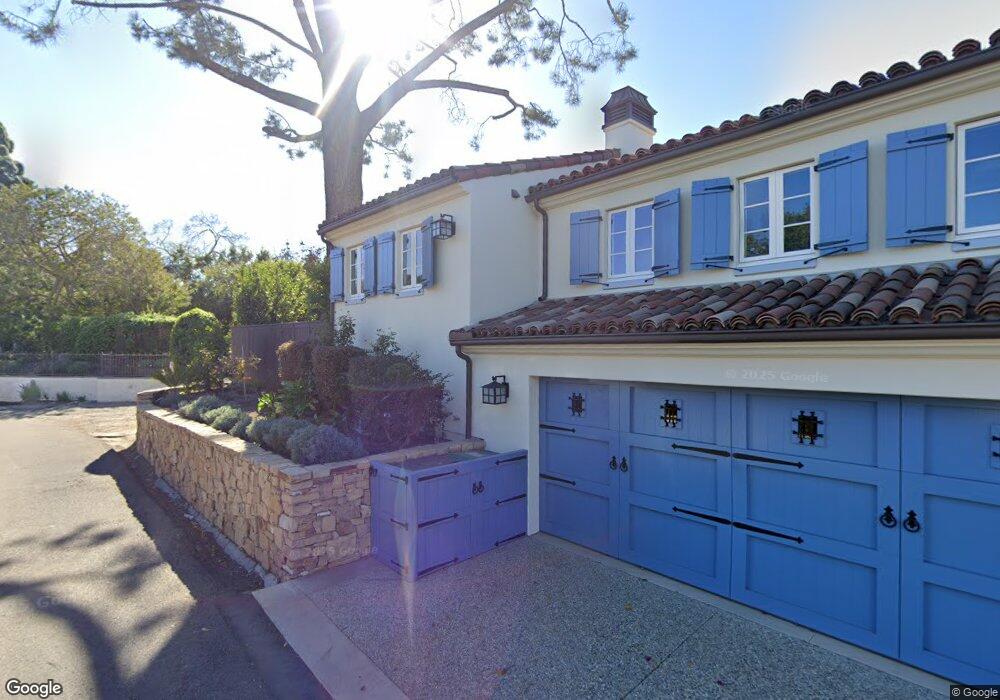
About This Home
This home is located at 4310 Avalon Dr, San Diego, CA 92103 and is currently estimated at $3,835,665, approximately $958 per square foot. 4310 Avalon Dr is a home located in San Diego County with nearby schools including Grant K-8, Richard Henry Dana Middle School, and Roosevelt International Middle School.
Ownership History
Date
Name
Owned For
Owner Type
Purchase Details
Closed on
Mar 6, 2025
Sold by
Spiridonov Deyan P
Bought by
Armstrong Sarah
Current Estimated Value
Purchase Details
Closed on
Jul 19, 2016
Sold by
Spiridonov Deyan P and Spiridonov Sarah C
Bought by
Spiridonov Deyan P
Home Financials for this Owner
Home Financials are based on the most recent Mortgage that was taken out on this home.
Original Mortgage
$1,641,600
Interest Rate
8.99%
Mortgage Type
Adjustable Rate Mortgage/ARM
Purchase Details
Closed on
Mar 5, 2012
Sold by
Carter Judith Jenkins
Bought by
Spiridonov Deyan P and Spiridonov Sarah C
Home Financials for this Owner
Home Financials are based on the most recent Mortgage that was taken out on this home.
Original Mortgage
$1,272,000
Interest Rate
3.83%
Mortgage Type
Seller Take Back
Purchase Details
Closed on
Jul 12, 2006
Sold by
Carter Thomas F and Carter Judith J
Bought by
Carter Thomas F and Carter Judith Jenkins
Create a Home Valuation Report for This Property
The Home Valuation Report is an in-depth analysis detailing your home's value as well as a comparison with similar homes in the area
Home Values in the Area
Average Home Value in this Area
Purchase History
| Date | Buyer | Sale Price | Title Company |
|---|---|---|---|
| Armstrong Sarah | -- | None Listed On Document | |
| Spiridonov Deyan P | -- | Ticor Title San Diego | |
| Spiridonov Deyan P | $1,800,000 | Advantage Title Inc | |
| Carter Thomas F | -- | None Available |
Source: Public Records
Mortgage History
| Date | Status | Borrower | Loan Amount |
|---|---|---|---|
| Previous Owner | Spiridonov Deyan P | $1,641,600 | |
| Previous Owner | Spiridonov Deyan P | $1,272,000 |
Source: Public Records
Tax History Compared to Growth
Tax History
| Year | Tax Paid | Tax Assessment Tax Assessment Total Assessment is a certain percentage of the fair market value that is determined by local assessors to be the total taxable value of land and additions on the property. | Land | Improvement |
|---|---|---|---|---|
| 2025 | $7,131 | $613,902 | $308,341 | $305,561 |
| 2024 | $7,131 | $575,234 | $285,526 | $289,708 |
| 2023 | $7,037 | $569,245 | $283,102 | $286,143 |
| 2022 | $8,670 | $707,771 | $367,363 | $340,408 |
| 2021 | $8,207 | $661,275 | $340,588 | $320,687 |
| 2020 | $7,810 | $630,276 | $322,565 | $307,711 |
| 2019 | $7,787 | $627,344 | $321,896 | $305,448 |
| 2018 | $23,397 | $1,987,027 | $1,324,685 | $662,342 |
| 2017 | $80 | $1,948,066 | $1,298,711 | $649,355 |
| 2016 | $22,481 | $1,909,870 | $1,273,247 | $636,623 |
| 2015 | $22,148 | $1,881,183 | $1,254,122 | $627,061 |
| 2014 | $21,798 | $1,844,334 | $1,229,556 | $614,778 |
Source: Public Records
Map
Nearby Homes
- 4396 Arcadia Dr
- 4171 Ibis St
- 4109 Ibis St
- Lot 19 Randolph St
- 720 W Lewis St Unit 6
- 4135 Eagle St
- 1605 Hotel Cir S Unit B102
- 1625 Hotel Cir S Unit C309
- 1621 Hotel Cir S Unit E228
- 1621 Hotel Cir S Unit E114
- 845 Fort Stockton Dr Unit 308
- 4055 Falcon St Unit 102
- 1329 Fort Stockton Dr
- 1728 W Lewis St
- 4095 Albatross St
- 3972 Jackdaw St
- 1753 W Lewis St
- 3963 Eagle St Unit 8
- 4080 Front St Unit 304
- 1860 W Montecito Way