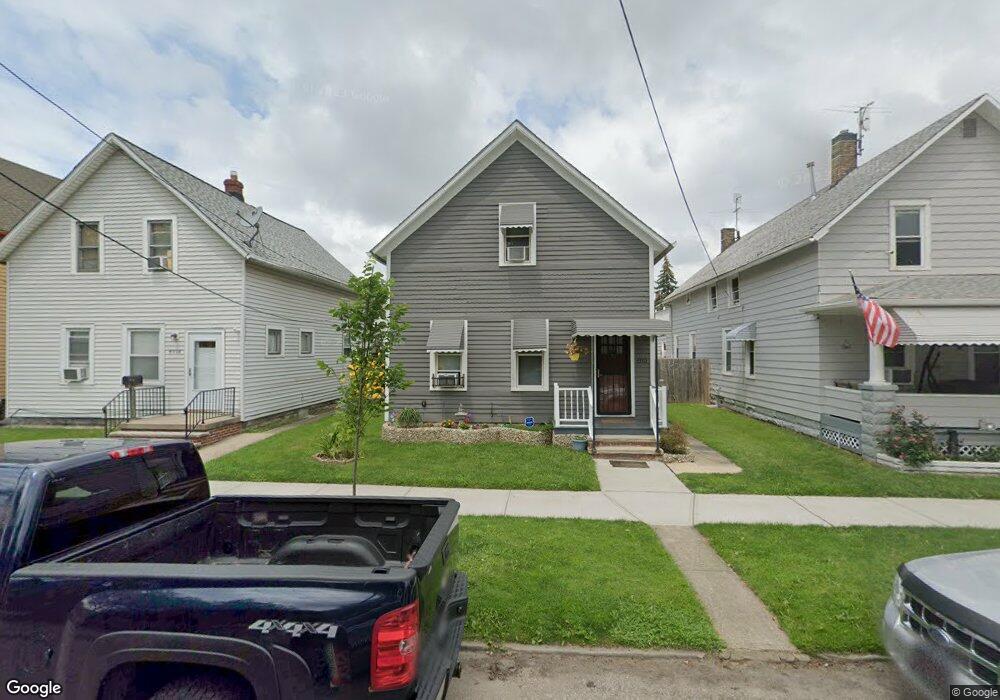
4310 Marvin Ave Cleveland, OH 44109
Clark-Fulton NeighborhoodEstimated Value: $91,382 - $133,000
2
Beds
1
Bath
1,299
Sq Ft
$82/Sq Ft
Est. Value
About This Home
This home is located at 4310 Marvin Ave, Cleveland, OH 44109 and is currently estimated at $106,596, approximately $82 per square foot. 4310 Marvin Ave is a home located in Cuyahoga County with nearby schools including Almira Academy, Benjamin Franklin, and Anton Grdina School.
Ownership History
Date
Name
Owned For
Owner Type
Purchase Details
Closed on
Sep 15, 2005
Sold by
Castro Julio C and Castro Norma L
Bought by
Figueroa William and Figueroa Mildred
Current Estimated Value
Home Financials for this Owner
Home Financials are based on the most recent Mortgage that was taken out on this home.
Original Mortgage
$50,500
Outstanding Balance
$27,153
Interest Rate
5.93%
Mortgage Type
Seller Take Back
Estimated Equity
$79,443
Purchase Details
Closed on
Apr 6, 2004
Sold by
Minute Eloise J and Armstrong Elsie V
Bought by
Castro Julio C and Castro Norma L
Purchase Details
Closed on
Aug 15, 1994
Sold by
Payne Frances L
Bought by
Armstrong Elsie V
Home Financials for this Owner
Home Financials are based on the most recent Mortgage that was taken out on this home.
Original Mortgage
$17,000
Interest Rate
8.62%
Mortgage Type
New Conventional
Purchase Details
Closed on
Jan 1, 1975
Bought by
Payne Frances L
Create a Home Valuation Report for This Property
The Home Valuation Report is an in-depth analysis detailing your home's value as well as a comparison with similar homes in the area
Home Values in the Area
Average Home Value in this Area
Purchase History
| Date | Buyer | Sale Price | Title Company |
|---|---|---|---|
| Figueroa William | $55,000 | Premier Title Agency Ltd | |
| Castro Julio C | $32,500 | Premier Title Agency Ltd | |
| Armstrong Elsie V | $20,000 | -- | |
| Payne Frances L | -- | -- |
Source: Public Records
Mortgage History
| Date | Status | Borrower | Loan Amount |
|---|---|---|---|
| Open | Figueroa William | $50,500 | |
| Previous Owner | Armstrong Elsie V | $17,000 |
Source: Public Records
Tax History Compared to Growth
Tax History
| Year | Tax Paid | Tax Assessment Tax Assessment Total Assessment is a certain percentage of the fair market value that is determined by local assessors to be the total taxable value of land and additions on the property. | Land | Improvement |
|---|---|---|---|---|
| 2024 | $1,560 | $23,800 | $5,880 | $17,920 |
| 2023 | $723 | $9,530 | $3,330 | $6,200 |
| 2022 | $719 | $9,520 | $3,330 | $6,200 |
| 2021 | $711 | $9,520 | $3,330 | $6,200 |
| 2020 | $632 | $7,320 | $2,560 | $4,760 |
| 2019 | $585 | $20,900 | $7,300 | $13,600 |
| 2018 | $621 | $7,320 | $2,560 | $4,760 |
| 2017 | $665 | $8,060 | $1,580 | $6,480 |
| 2016 | $660 | $8,060 | $1,580 | $6,480 |
| 2015 | $736 | $8,060 | $1,580 | $6,480 |
| 2014 | $736 | $8,960 | $1,750 | $7,210 |
Source: Public Records
Map
Nearby Homes
- 4302 Daisy Ave
- 4131 Woodbridge Ave
- 4420 Bush Ave
- 3411 W 46th St
- 4571 Sackett Ave
- 4301 Hodgson Ave
- 3319 W 44th St
- 3567 W 46th St
- 3431 W 49th St
- 3295 W 44th St
- 3420 W 49th St
- 3757 Trowbridge Ave
- 3374 Fulton Rd
- 3836 Storer Ave
- 3579 W 47th St
- 3608 W 45th St
- 3712 Daisy Ave
- 3914 Sackett Ave
- 3594 W 47th St
- 3612 Daisy Ave
- 4304 Marvin Ave
- 4318 Marvin Ave
- 4250 Marvin Ave
- 4324 Marvin Ave
- 4330 Marvin Ave
- 4242 Marvin Ave
- 4236 Marvin Ave
- 4336 Marvin Ave
- 4309 Woodbridge Ave
- 4305 Woodbridge Ave
- 4319 Woodbridge Ave
- 4323 Woodbridge Ave
- 4253 Woodbridge Ave
- 4340 Marvin Ave
- 4228 Marvin Ave
- 4307 Marvin Ave
- 3455 W 44th St
- 4315 Marvin Ave
- 4231 Woodbridge Ave
- 4321 Marvin Ave