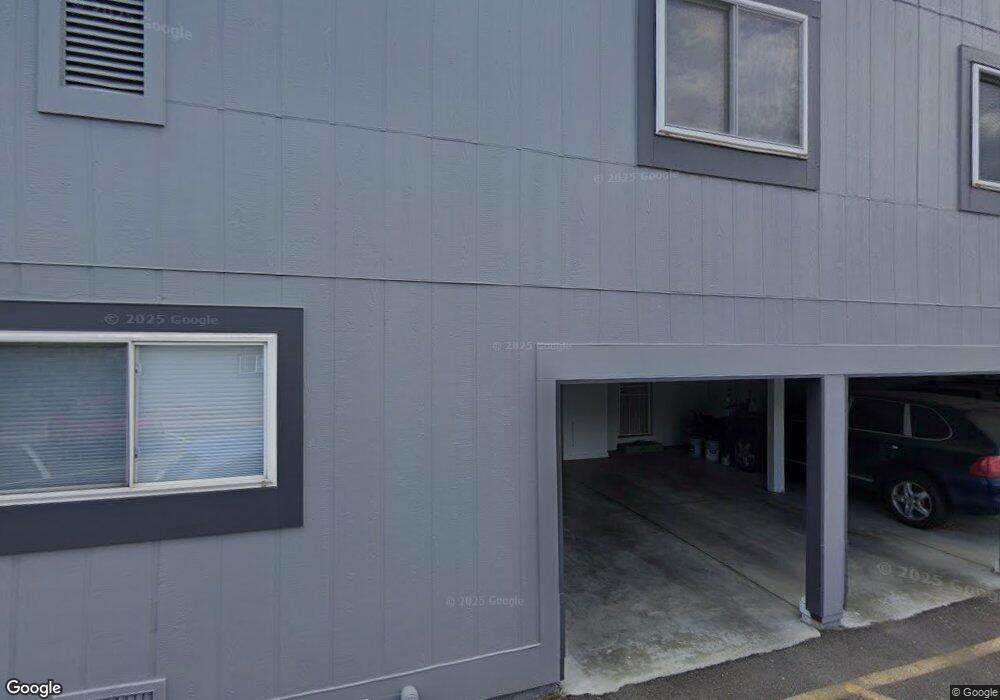
4310 Monroe Dr Unit C Boulder, CO 80303
East Aurora NeighborhoodEstimated Value: $486,872 - $511,000
2
Beds
2
Baths
1,056
Sq Ft
$468/Sq Ft
Est. Value
About This Home
This home is located at 4310 Monroe Dr Unit C, Boulder, CO 80303 and is currently estimated at $494,718, approximately $468 per square foot. 4310 Monroe Dr Unit C is a home located in Boulder County with nearby schools including Creekside Elementary School, Manhattan Middle School of the Arts & Academics, and Fairview High School.
Ownership History
Date
Name
Owned For
Owner Type
Purchase Details
Closed on
Aug 16, 2007
Sold by
Abrams Julie
Bought by
Friess Elisabeth P
Current Estimated Value
Purchase Details
Closed on
May 14, 2004
Sold by
Mcjoynt Sally A
Bought by
Abrams Julie
Home Financials for this Owner
Home Financials are based on the most recent Mortgage that was taken out on this home.
Original Mortgage
$172,000
Interest Rate
4.62%
Mortgage Type
Purchase Money Mortgage
Purchase Details
Closed on
Mar 18, 1998
Sold by
Mcjoynt David L A and Mcjoynt Sally A
Bought by
Mcjoynt Sally A
Home Financials for this Owner
Home Financials are based on the most recent Mortgage that was taken out on this home.
Original Mortgage
$76,200
Interest Rate
7.12%
Purchase Details
Closed on
Jan 14, 1994
Sold by
Burkepile James M and Burkepile Norma Diane
Bought by
Mcjoynt David L
Home Financials for this Owner
Home Financials are based on the most recent Mortgage that was taken out on this home.
Original Mortgage
$79,920
Interest Rate
4.5%
Purchase Details
Closed on
Oct 20, 1983
Bought by
Friess Elisabeth P
Purchase Details
Closed on
Jul 5, 1978
Bought by
Friess Elisabeth P
Create a Home Valuation Report for This Property
The Home Valuation Report is an in-depth analysis detailing your home's value as well as a comparison with similar homes in the area
Home Values in the Area
Average Home Value in this Area
Purchase History
We collect this data history from publicly available records. To have your information removed, we recommend requesting removal directly through your county’s website.
| Date | Buyer | Sale Price | Title Company |
|---|---|---|---|
| Friess Elisabeth P | $222,000 | Land Title Guarantee Company | |
| Abrams Julie | $215,000 | Land Title | |
| Mcjoynt Sally A | -- | Land Title | |
| Mcjoynt David L | $99,900 | -- | |
| Friess Elisabeth P | $65,000 | -- | |
| Friess Elisabeth P | $45,500 | -- |
Source: Public Records
Mortgage History
We collect this data history from publicly available records. To have your information removed, we recommend requesting removal directly through your county’s website.
| Date | Status | Borrower | Loan Amount |
|---|---|---|---|
| Previous Owner | Abrams Julie | $172,000 | |
| Previous Owner | Mcjoynt Sally A | $76,200 | |
| Previous Owner | Mcjoynt David L | $79,920 |
Source: Public Records
Tax History
| Year | Tax Paid | Tax Assessment Tax Assessment Total Assessment is a certain percentage of the fair market value that is determined by local assessors to be the total taxable value of land and additions on the property. | Land | Improvement |
|---|---|---|---|---|
| 2025 | $2,557 | $31,156 | $7,425 | $23,731 |
| 2024 | $2,557 | $31,156 | $7,425 | $23,731 |
| 2023 | $2,513 | $29,098 | $9,782 | $23,001 |
| 2022 | $2,519 | $27,126 | $7,061 | $20,065 |
| 2021 | $2,402 | $27,906 | $7,264 | $20,642 |
| 2020 | $2,716 | $31,203 | $7,150 | $24,053 |
| 2019 | $2,675 | $31,203 | $7,150 | $24,053 |
| 2018 | $2,140 | $24,682 | $9,864 | $14,818 |
| 2017 | $2,073 | $27,287 | $10,905 | $16,382 |
| 2016 | $1,776 | $20,513 | $8,199 | $12,314 |
| 2015 | $1,682 | $17,822 | $7,164 | $10,658 |
| 2014 | $1,532 | $17,822 | $7,164 | $10,658 |
Source: Public Records
Map
Nearby Homes
- 4264 Monroe Dr Unit C
- 4222 Monroe Dr Unit C
- 1160 Monroe Dr Unit C
- 900 Morgan Dr
- 878 Morgan Dr
- 1129 Monroe Dr Unit D
- 1189 Monroe Dr Unit D
- 905 36th St
- 1060 35th St
- 650-654 Inca Pkwy
- 4500 Baseline Rd Unit 4302
- 4475 Laguna Place Unit 201
- 4425 Comanche Dr
- 3265 Euclid Ave
- 3235 Euclid Ave
- 3161 Madison Ave Unit P222
- 3161 Madison Ave Unit O427
- 3161 Madison Ave Unit 313
- 3161 Madison Ave Unit N308
- 3161 Madison Ave Unit P317
- 4310 Monroe Dr Unit D
- 4310 Monroe Dr Unit B
- 4310 Monroe Dr Unit A
- 4320 Monroe Dr Unit D
- 4320 Monroe Dr Unit C
- 4320 Monroe Dr Unit B
- 4320 Monroe Dr Unit A
- 4340 Monroe Dr Unit D
- 4340 Monroe Dr Unit C
- 4340 Monroe Dr Unit B
- 4340 Monroe Dr Unit A
- 4264 Monroe Dr Unit D
- 4264 Monroe Dr Unit B
- 4264 Monroe Dr Unit A
- 4330 Monroe Dr Unit D
- 4330 Monroe Dr Unit C
- 4330 Monroe Dr Unit B
- 4330 Monroe Dr Unit A
- 4300 Monroe Dr Unit D
- 4300 Monroe Dr Unit C
Your Personal Tour Guide
Ask me questions while you tour the home.