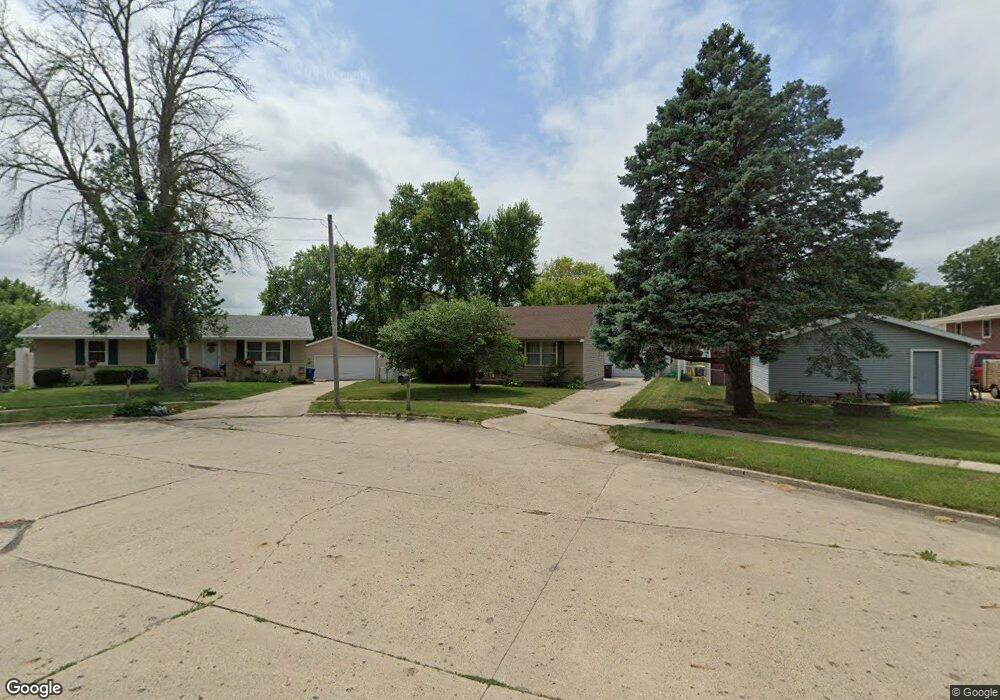
4310 SE 4th Ct Des Moines, IA 50315
South Central DSM NeighborhoodEstimated Value: $194,745 - $206,000
3
Beds
1
Bath
864
Sq Ft
$232/Sq Ft
Est. Value
About This Home
This home is located at 4310 SE 4th Ct, Des Moines, IA 50315 and is currently estimated at $200,186, approximately $231 per square foot. 4310 SE 4th Ct is a home located in Polk County with nearby schools including South Union Elementary School, Weeks Middle School, and Lincoln High School.
Ownership History
Date
Name
Owned For
Owner Type
Purchase Details
Closed on
Nov 7, 2005
Sold by
Kennedy Jaime B
Bought by
Waters Michael Todd
Current Estimated Value
Home Financials for this Owner
Home Financials are based on the most recent Mortgage that was taken out on this home.
Original Mortgage
$92,800
Outstanding Balance
$50,357
Interest Rate
5.98%
Mortgage Type
Fannie Mae Freddie Mac
Estimated Equity
$149,829
Purchase Details
Closed on
Aug 15, 2001
Sold by
Fuson Verle Eugene and Fuson Ellen Louise
Bought by
Lamb James A and Lamb Cynthia J
Home Financials for this Owner
Home Financials are based on the most recent Mortgage that was taken out on this home.
Original Mortgage
$113,202
Interest Rate
7.23%
Mortgage Type
FHA
Purchase Details
Closed on
Aug 28, 1999
Sold by
Parson Julie Diane and Parsons Robert
Bought by
Waters Michael Todd and Kennedy Jaime B
Home Financials for this Owner
Home Financials are based on the most recent Mortgage that was taken out on this home.
Original Mortgage
$93,200
Interest Rate
7.59%
Mortgage Type
FHA
Create a Home Valuation Report for This Property
The Home Valuation Report is an in-depth analysis detailing your home's value as well as a comparison with similar homes in the area
Home Values in the Area
Average Home Value in this Area
Purchase History
| Date | Buyer | Sale Price | Title Company |
|---|---|---|---|
| Waters Michael Todd | $3,000 | -- | |
| Lamb James A | $114,000 | -- | |
| Waters Michael Todd | $93,500 | -- |
Source: Public Records
Mortgage History
| Date | Status | Borrower | Loan Amount |
|---|---|---|---|
| Open | Waters Michael Todd | $92,800 | |
| Previous Owner | Lamb James A | $113,202 | |
| Previous Owner | Waters Michael Todd | $93,200 |
Source: Public Records
Tax History Compared to Growth
Tax History
| Year | Tax Paid | Tax Assessment Tax Assessment Total Assessment is a certain percentage of the fair market value that is determined by local assessors to be the total taxable value of land and additions on the property. | Land | Improvement |
|---|---|---|---|---|
| 2025 | $3,232 | $186,100 | $36,700 | $149,400 |
| 2024 | $3,232 | $164,300 | $32,000 | $132,300 |
| 2023 | $3,108 | $164,300 | $32,000 | $132,300 |
| 2022 | $3,084 | $131,900 | $26,200 | $105,700 |
| 2021 | $3,212 | $131,900 | $26,200 | $105,700 |
| 2020 | $3,336 | $128,700 | $25,500 | $103,200 |
| 2019 | $3,058 | $128,700 | $25,500 | $103,200 |
| 2018 | $3,028 | $113,800 | $22,100 | $91,700 |
| 2017 | $2,770 | $113,800 | $22,100 | $91,700 |
| 2016 | $2,698 | $102,400 | $19,600 | $82,800 |
| 2015 | $2,698 | $102,400 | $19,600 | $82,800 |
| 2014 | $2,706 | $105,700 | $19,900 | $85,800 |
Source: Public Records
Map
Nearby Homes
- 4316 SE 4th St
- 409 Wilmers Ave
- 448 Scandia Ave
- 433 E Marion St
- 209 E Philip St
- 126 E Maxwelton Dr
- 108 E Philip St
- 311 E Emma Ave
- 3909 SE 5th St
- 705 E Watrous Ave
- 102 E Emma Ave
- 117 E Watrous Ave
- 4024 SE 8th St
- 314 E Rose Ave
- 117 E Rose Ave
- 115 Mckinley Ave
- 712 E Hackley Ave
- 1201 E Philip St
- 442 E Miller Ave
- 801 E Hackley Ave
- 4316 SE 4th Ct
- 417 E Trowbridge St
- 4311 SE 4th St
- 423 E Trowbridge St
- 411 E Trowbridge St
- 4317 SE 4th St
- 4323 SE 4th Ct
- 403 E Trowbridge St
- 410 Wilmers Ave
- 416 Wilmers Ave
- 4307 SE 4th Ct
- 4311 SE 4th Ct
- 4317 SE 4th Ct
- 406 Wilmers Ave
- 420 Wilmers Ave
- 4301 SE 4th Ct
- 4322 SE 4th St
- 400 Wilmers Ave
- 424 Wilmers Ave
- 416 E Trowbridge St