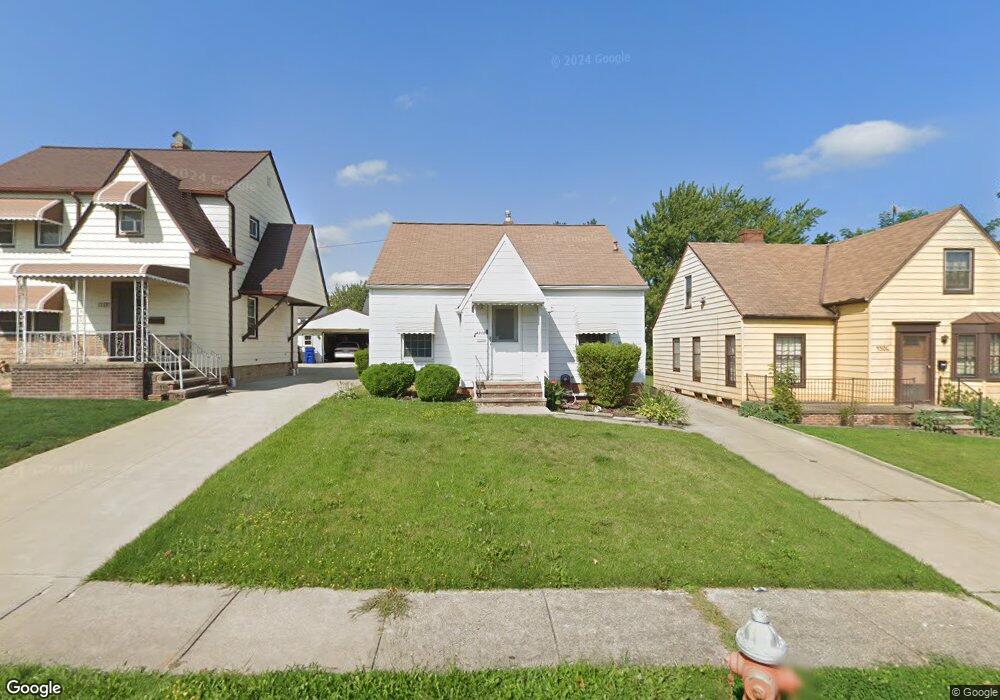
4310 W 60th St Cleveland, OH 44144
Old Brooklyn NeighborhoodEstimated Value: $166,284 - $206,000
3
Beds
2
Baths
1,344
Sq Ft
$140/Sq Ft
Est. Value
About This Home
This home is located at 4310 W 60th St, Cleveland, OH 44144 and is currently estimated at $188,321, approximately $140 per square foot. 4310 W 60th St is a home located in Cuyahoga County with nearby schools including Benjamin Franklin, Almira Academy, and Artemus Ward School.
Ownership History
Date
Name
Owned For
Owner Type
Purchase Details
Closed on
Oct 5, 2015
Sold by
Mcdaniel Maurice
Bought by
Labbad Joseline J
Current Estimated Value
Purchase Details
Closed on
Aug 29, 2006
Sold by
Twigger William R
Bought by
Mcdaniel Maurice A and Labbad Joseline J
Home Financials for this Owner
Home Financials are based on the most recent Mortgage that was taken out on this home.
Original Mortgage
$116,400
Interest Rate
6.88%
Mortgage Type
Purchase Money Mortgage
Purchase Details
Closed on
May 30, 1997
Sold by
Fitzgerald Michael P
Bought by
Twigger William R
Home Financials for this Owner
Home Financials are based on the most recent Mortgage that was taken out on this home.
Original Mortgage
$67,400
Interest Rate
8.27%
Mortgage Type
New Conventional
Purchase Details
Closed on
Aug 5, 1993
Sold by
Zbrzeski Joseph
Bought by
Fitzgerald Michael P
Purchase Details
Closed on
Mar 14, 1977
Sold by
Zbrzeski Joseph
Bought by
Zbrzeski Joseph
Purchase Details
Closed on
Jan 1, 1975
Bought by
Zbrzeski Isabella
Create a Home Valuation Report for This Property
The Home Valuation Report is an in-depth analysis detailing your home's value as well as a comparison with similar homes in the area
Home Values in the Area
Average Home Value in this Area
Purchase History
| Date | Buyer | Sale Price | Title Company |
|---|---|---|---|
| Labbad Joseline J | -- | Attorney | |
| Mcdaniel Maurice A | $116,400 | Mortgage Info | |
| Twigger William R | $74,900 | -- | |
| Fitzgerald Michael P | $65,000 | -- | |
| Zbrzeski Joseph | -- | -- | |
| Zbrzeski Isabella | -- | -- |
Source: Public Records
Mortgage History
| Date | Status | Borrower | Loan Amount |
|---|---|---|---|
| Previous Owner | Mcdaniel Maurice A | $116,400 | |
| Previous Owner | Twigger William R | $67,400 |
Source: Public Records
Tax History Compared to Growth
Tax History
| Year | Tax Paid | Tax Assessment Tax Assessment Total Assessment is a certain percentage of the fair market value that is determined by local assessors to be the total taxable value of land and additions on the property. | Land | Improvement |
|---|---|---|---|---|
| 2024 | $3,212 | $49,000 | $8,820 | $40,180 |
| 2023 | $2,969 | $39,140 | $6,340 | $32,800 |
| 2022 | $2,952 | $39,130 | $6,340 | $32,800 |
| 2021 | $2,922 | $39,130 | $6,340 | $32,800 |
| 2020 | $2,618 | $30,310 | $4,900 | $25,410 |
| 2019 | $2,420 | $86,600 | $14,000 | $72,600 |
| 2018 | $2,412 | $30,310 | $4,900 | $25,410 |
| 2017 | $2,274 | $27,580 | $4,270 | $23,310 |
| 2016 | $2,257 | $27,580 | $4,270 | $23,310 |
| 2015 | $2,515 | $27,580 | $4,270 | $23,310 |
| 2014 | $2,515 | $30,630 | $4,760 | $25,870 |
Source: Public Records
Map
Nearby Homes
- 4215 W 58th St
- 6706 Woodhaven Ave
- 6904 & 6908 Southfield Ave
- 7010 Woodhaven Ave
- 4373 W 52nd St
- 6408 Dellbank Dr
- 4464 W 53rd St
- 4098 W 57th St
- 7108 Brookside Dr
- 4484 W 53rd St
- 7420 Outlook Ave
- 4456 W 49th St
- 4427 W 49th St
- 4140 W 49th St
- 4109 W 50th St
- 7506 Brookside Dr
- 4811 Ardmore Ave
- 5000 Behrwald Ave
- 5105 Behrwald Ave
- 4510 Woburn Ave
- 4306 W 60th St
- 4314 W 60th St
- 4318 W 60th St
- 6009 Memphis Ave
- 4309 W 61st St
- 4322 W 60th St
- 4313 W 61st St
- 4305 W 61st St
- 4317 W 61st St
- 4301 W 61st St
- 4326 W 60th St
- 6003 Memphis Ave
- 4309 W 60th St
- 4313 W 60th St
- 4321 W 61st St
- 4305 W 60th St
- 4301 W 60th St
- 4317 W 60th St
- 4330 W 60th St
- 4325 W 61st St