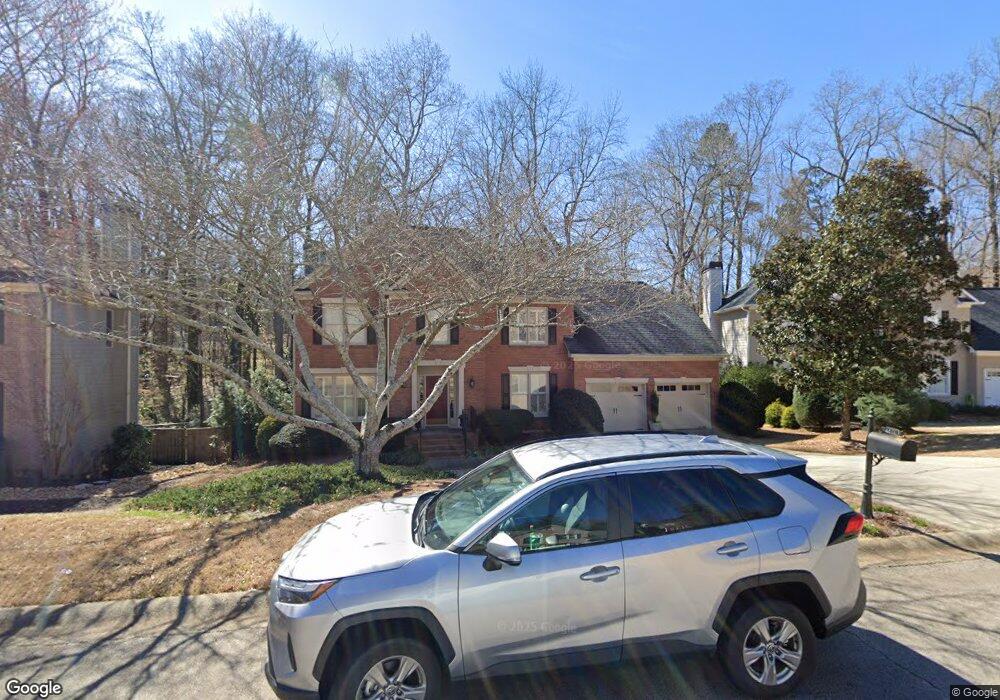
4310 Woodhaven Way SE Smyrna, GA 30082
Estimated Value: $674,000 - $715,000
4
Beds
4
Baths
2,592
Sq Ft
$269/Sq Ft
Est. Value
About This Home
This home is located at 4310 Woodhaven Way SE, Smyrna, GA 30082 and is currently estimated at $697,995, approximately $269 per square foot. 4310 Woodhaven Way SE is a home located in Cobb County with nearby schools including King Springs Elementary School, Griffin Middle School, and Campbell High School.
Ownership History
Date
Name
Owned For
Owner Type
Purchase Details
Closed on
Sep 30, 2003
Sold by
Gow James A and Gow Josephine J
Bought by
Boyd Robert J and Boyd Leslie
Current Estimated Value
Home Financials for this Owner
Home Financials are based on the most recent Mortgage that was taken out on this home.
Original Mortgage
$200,000
Outstanding Balance
$93,290
Interest Rate
6.32%
Mortgage Type
New Conventional
Estimated Equity
$604,705
Purchase Details
Closed on
Sep 27, 2001
Sold by
Tilt Leroy W and Tilt Lori R
Bought by
Gow James A
Home Financials for this Owner
Home Financials are based on the most recent Mortgage that was taken out on this home.
Original Mortgage
$275,000
Interest Rate
5.25%
Mortgage Type
New Conventional
Purchase Details
Closed on
Mar 26, 1997
Sold by
Traton Corp Cobb Inc
Bought by
Tilt Leroy W Lori R
Create a Home Valuation Report for This Property
The Home Valuation Report is an in-depth analysis detailing your home's value as well as a comparison with similar homes in the area
Home Values in the Area
Average Home Value in this Area
Purchase History
| Date | Buyer | Sale Price | Title Company |
|---|---|---|---|
| Boyd Robert J | $292,000 | -- | |
| Gow James A | $275,000 | -- | |
| Tilt Leroy W Lori R | $184,600 | -- |
Source: Public Records
Mortgage History
| Date | Status | Borrower | Loan Amount |
|---|---|---|---|
| Open | Boyd Robert J | $200,000 | |
| Previous Owner | Gow James A | $275,000 | |
| Closed | Tilt Leroy W Lori R | $0 |
Source: Public Records
Tax History Compared to Growth
Tax History
| Year | Tax Paid | Tax Assessment Tax Assessment Total Assessment is a certain percentage of the fair market value that is determined by local assessors to be the total taxable value of land and additions on the property. | Land | Improvement |
|---|---|---|---|---|
| 2025 | $4,564 | $216,000 | $60,000 | $156,000 |
| 2024 | $4,564 | $216,000 | $60,000 | $156,000 |
| 2023 | $4,501 | $238,772 | $60,000 | $178,772 |
| 2022 | $3,942 | $180,904 | $34,000 | $146,904 |
| 2021 | $3,965 | $180,904 | $34,000 | $146,904 |
| 2020 | $3,965 | $180,904 | $34,000 | $146,904 |
| 2019 | $3,812 | $172,848 | $28,000 | $144,848 |
| 2018 | $3,339 | $148,032 | $28,000 | $120,032 |
| 2017 | $3,197 | $148,032 | $28,000 | $120,032 |
| 2016 | $2,955 | $135,052 | $28,000 | $107,052 |
| 2015 | $3,013 | $135,052 | $28,000 | $107,052 |
| 2014 | $2,879 | $126,904 | $0 | $0 |
Source: Public Records
Map
Nearby Homes
- 303 Mill Pond Ct SE
- 3844 Lake Dr SE
- 702 Mill Pond Dr SE
- 3941 Lake Dr SE
- 505 Bridge Ln SE
- 502 Bridge Ln SE
- 606 Mill Pond Dr SE
- 609 Mill Pond Dr SE
- 610 Mill Pond Dr SE
- 3654 Lake Dr SE
- 904 Bridge Ln SE
- 931 Hidden Falls Ln SE
- 1522 Grace Meadows Ln SE
- 1024 Magnolia Dr SE
- 116 Festoon Ct
- 3568 Lake Dr SE
- 951 Reed Rd SE
- 4222 Terrace Ct SE
- 4312 Woodhaven Way SE
- 4308 Woodhaven Way SE
- 4305 Woodhaven Way SE
- 4306 Woodhaven Way SE
- 4303 Woodhaven Way SE
- 0 Woodhaven Way Unit 7406525
- 910 Highview Dr SE
- 4311 Woodhaven Way SE
- 920 Highview Dr SE
- 4307 Woodhaven Way SE
- 4309 Woodhaven Way SE
- 4304 Woodhaven Way SE
- 930 Highview Dr SE
- 900 Highview Dr SE
- 4301 Woodhaven Way SE
- 3810 Gann Rd SE
- 1305 Woodhaven Ln SE
- 1303 Woodhaven Ln SE
- 4302 Woodhaven Way SE
- 3751 Lake Dr SE