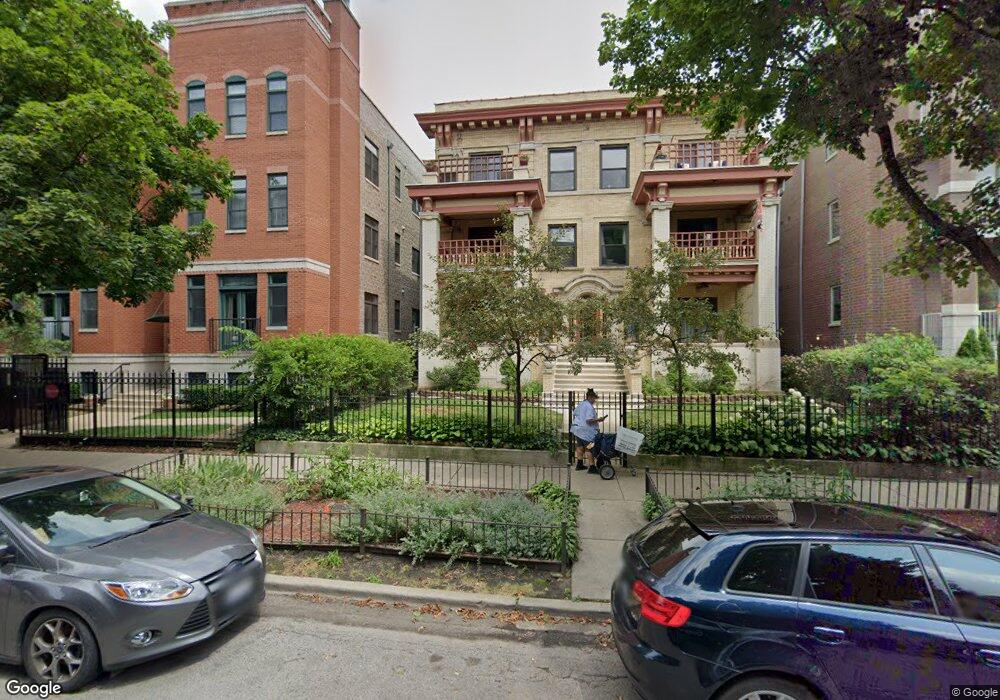
4311 N Kenmore Ave Unit G3 Chicago, IL 60613
Buena Park NeighborhoodEstimated Value: $450,000 - $484,000
--
Bed
--
Bath
11,780
Sq Ft
$40/Sq Ft
Est. Value
About This Home
This home is located at 4311 N Kenmore Ave Unit G3, Chicago, IL 60613 and is currently estimated at $465,354, approximately $39 per square foot. 4311 N Kenmore Ave Unit G3 is a home located in Cook County with nearby schools including Brennemann Elementary School, Senn High School, and St Mary Of The Lake School.
Ownership History
Date
Name
Owned For
Owner Type
Purchase Details
Closed on
Sep 16, 2019
Sold by
Cofalu Gina M and Reilly James S
Bought by
Gaswick Grace E and Gaswick Watt C
Current Estimated Value
Home Financials for this Owner
Home Financials are based on the most recent Mortgage that was taken out on this home.
Original Mortgage
$277,600
Outstanding Balance
$243,256
Interest Rate
3.62%
Mortgage Type
New Conventional
Estimated Equity
$222,098
Purchase Details
Closed on
Aug 28, 2013
Sold by
Martinez Alfredo J and Martinez Juana
Bought by
Cefalu Gina M and Reilly James S
Home Financials for this Owner
Home Financials are based on the most recent Mortgage that was taken out on this home.
Original Mortgage
$238,125
Interest Rate
4.33%
Mortgage Type
New Conventional
Create a Home Valuation Report for This Property
The Home Valuation Report is an in-depth analysis detailing your home's value as well as a comparison with similar homes in the area
Home Values in the Area
Average Home Value in this Area
Purchase History
| Date | Buyer | Sale Price | Title Company |
|---|---|---|---|
| Gaswick Grace E | $347,000 | Attorneys Ttl Guaranty Fund | |
| Cefalu Gina M | $317,500 | Heritage Title Company |
Source: Public Records
Mortgage History
| Date | Status | Borrower | Loan Amount |
|---|---|---|---|
| Open | Gaswick Grace E | $277,600 | |
| Previous Owner | Cefalu Gina M | $238,125 |
Source: Public Records
Tax History Compared to Growth
Tax History
| Year | Tax Paid | Tax Assessment Tax Assessment Total Assessment is a certain percentage of the fair market value that is determined by local assessors to be the total taxable value of land and additions on the property. | Land | Improvement |
|---|---|---|---|---|
| 2024 | $197 | $1,943 | $447 | $1,496 |
| 2023 | $192 | $933 | $360 | $573 |
| 2022 | $192 | $933 | $360 | $573 |
| 2021 | $187 | $932 | $359 | $573 |
| 2020 | $295 | $1,323 | $275 | $1,048 |
| 2019 | $296 | $1,474 | $275 | $1,199 |
| 2018 | $291 | $1,474 | $275 | $1,199 |
| 2017 | $341 | $1,586 | $239 | $1,347 |
| 2016 | $318 | $1,586 | $239 | $1,347 |
| 2015 | $291 | $1,586 | $239 | $1,347 |
| 2014 | $236 | $1,272 | $182 | $1,090 |
| 2013 | $231 | $1,272 | $182 | $1,090 |
Source: Public Records
Map
Nearby Homes
- 4214 N Kenmore Ave Unit 2F
- 4301 N Sheridan Rd Unit 202
- 4336 N Kenmore Ave Unit 1S
- 4144 N Sheridan Rd Unit 407
- 4144 N Sheridan Rd Unit 510
- 4144 N Sheridan Rd Unit 408
- 4133 N Kenmore Ave Unit 2E
- 4133 N Kenmore Ave Unit 1S
- 945 W Gordon Terrace Unit 2W
- 945 W Agatite Ave Unit 3
- 4417 N Racine Ave Unit 1N
- 4334 N Dayton St Unit G
- 4418 N Racine Ave Unit 2N
- 4240 N Clarendon Ave Unit 309N
- 4240 N Clarendon Ave Unit 200S
- 4240 N Clarendon Ave Unit 213N
- 4038 N Kenmore Ave Unit 2
- 958 W Cuyler Ave Unit 958
- 4516 N Sheridan Rd
- 844 W Agatite Ave Unit 2W
- 4311 N Kenmore Ave Unit 1
- 4311 N Kenmore Ave Unit 2
- 4311 N Kenmore Ave Unit 43113
- 4309 N Kenmore Ave Unit 43093
- 4309 N Kenmore Ave Unit 43092
- 4309 N Kenmore Ave Unit 43091
- 4311 N Kenmore Ave Unit G5
- 4311 N Kenmore Ave Unit G4
- 4311 N Kenmore Ave Unit 43112
- 4311 N Kenmore Ave Unit 43111
- 4311 N Kenmore Ave Unit G1
- 4311 N Kenmore Ave Unit G2
- 4311 N Kenmore Ave Unit 2N
- 4311 N Kenmore Ave Unit 3N
- 4309 N Kenmore Ave Unit 3
- 4309 N Kenmore Ave Unit 2
- 4309 N Kenmore Ave Unit 1
- 4303 N Kenmore Ave
- 4303 N Kenmore Ave Unit 3N
- 4303 N Kenmore Ave Unit 4N