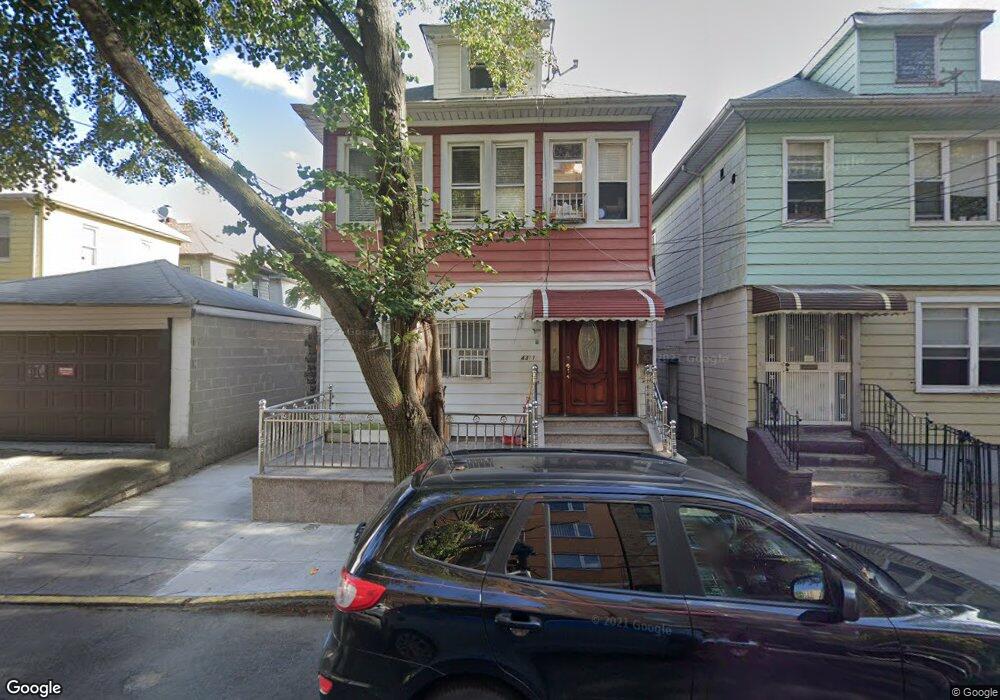
4311 Robinson St Flushing, NY 11355
Flushing-Willets Point NeighborhoodEstimated Value: $1,326,936 - $1,780,000
Studio
--
Bath
2,320
Sq Ft
$681/Sq Ft
Est. Value
About This Home
This home is located at 4311 Robinson St, Flushing, NY 11355 and is currently estimated at $1,578,984, approximately $680 per square foot. 4311 Robinson St is a home located in Queens County with nearby schools including P.S. 024 Andrew Jackson School, Rachel Carson I.S. 237Q, and John Bowne High School.
Ownership History
Date
Name
Owned For
Owner Type
Purchase Details
Closed on
Mar 30, 2006
Sold by
Jainarain Karran and Jainarain Natasha V
Bought by
Jin Hong Huang and Qing Fa Chen
Current Estimated Value
Purchase Details
Closed on
Aug 20, 2001
Sold by
Jatnarain Shamdai and Jainarain Karran N
Bought by
Jainarain Shamdai and Jainarain Karran N
Home Financials for this Owner
Home Financials are based on the most recent Mortgage that was taken out on this home.
Original Mortgage
$467
Interest Rate
6.77%
Purchase Details
Closed on
Oct 15, 1997
Sold by
Ortega Rina Bayona and Bocangel Oscar
Bought by
Jainarain Shamdai and Jainarain Karran N
Home Financials for this Owner
Home Financials are based on the most recent Mortgage that was taken out on this home.
Original Mortgage
$234,800
Interest Rate
7.26%
Create a Home Valuation Report for This Property
The Home Valuation Report is an in-depth analysis detailing your home's value as well as a comparison with similar homes in the area
Home Values in the Area
Average Home Value in this Area
Purchase History
| Date | Buyer | Sale Price | Title Company |
|---|---|---|---|
| Jin Hong Huang | $820,000 | -- | |
| Jainarain Shamdai | -- | -- | |
| Jainarain Shamdai | $247,200 | First American Title Ins Co |
Source: Public Records
Mortgage History
| Date | Status | Borrower | Loan Amount |
|---|---|---|---|
| Previous Owner | Jainarain Shamdai | $467 | |
| Previous Owner | Jainarain Shamdai | $234,800 |
Source: Public Records
Tax History
| Year | Tax Paid | Tax Assessment Tax Assessment Total Assessment is a certain percentage of the fair market value that is determined by local assessors to be the total taxable value of land and additions on the property. | Land | Improvement |
|---|---|---|---|---|
| 2025 | $9,996 | $52,752 | $9,643 | $43,109 |
| 2024 | $9,996 | $49,766 | $8,546 | $41,220 |
| 2023 | $9,959 | $49,584 | $8,744 | $40,840 |
| 2022 | $9,339 | $86,700 | $15,300 | $71,400 |
| 2021 | $9,806 | $73,080 | $15,300 | $57,780 |
| 2020 | $9,305 | $78,780 | $15,300 | $63,480 |
| 2019 | $8,676 | $70,500 | $15,300 | $55,200 |
| 2018 | $8,423 | $41,320 | $11,617 | $29,703 |
| 2017 | $7,947 | $38,983 | $10,541 | $28,442 |
| 2016 | $7,762 | $38,983 | $10,541 | $28,442 |
| 2015 | $4,216 | $36,633 | $12,013 | $24,620 |
| 2014 | $4,216 | $34,560 | $13,603 | $20,957 |
Source: Public Records
Map
Nearby Homes
- 43-18 Robinson St Unit 7D
- 141-18 Cherry Ave Unit Parking
- 141-15 Cherry Ave Unit 5C
- 141-15 Cherry Ave Unit 4D
- 141-15 Cherry Ave Unit 4E
- 141-15 Cherry Ave Unit 6B
- 141-15 Cherry Ave Unit 3D
- 141-15 Cherry Ave Unit 5E
- 141-15 Cherry Ave Unit 3E
- 141-15 Cherry Ave Unit 2E
- 141-15 Cherry Ave Unit 6E
- 141-15 Cherry Ave Unit 5D
- 4317 Union St Unit 2B
- 4317 Union St Unit 6E
- 43-17 Union St Unit 6C
- 14105 Cherry Ave Unit 4D
- 43-35 Union St Unit 2M
- 43-35 Union St Unit 2G
- 31-16 Union St
- 140-65 Beech Ave Unit 3C
- 4315 Robinson St
- 4317 Robinson St
- 14204 Cherry Ave
- 14208 Cherry Ave
- 14202 Cherry Ave
- 14210 Cherry Ave
- 4321 Robinson St
- 4312 Bowne St
- 14214 Cherry Ave
- 4316 Bowne St
- 142-14 Cherry Ave Unit 2nd Fl
- 4325 Robinson St
- 4318 Bowne St
- 142-02 Cherry Ave Unit 2nd Fl
- 142-02 Cherry Ave Unit 2 FL
- 142-02 Cherry Ave
- 43-18 Robinson St Unit 6C
- 43-18 Robinson St Unit 7Fl
- 43-18 Robinson St Unit 3B
- 43-18 Robinson St Unit 7C
Your Personal Tour Guide
Ask me questions while you tour the home.