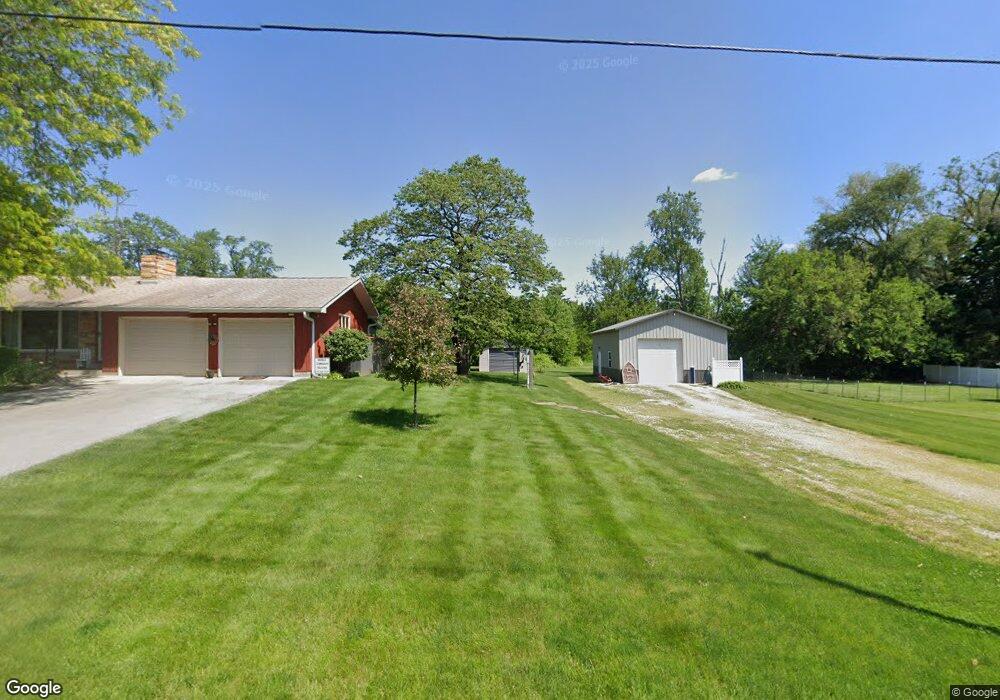
4311 W 800 S Union Mills, IN 46382
Estimated Value: $206,919 - $234,000
2
Beds
2
Baths
1,080
Sq Ft
$202/Sq Ft
Est. Value
About This Home
This home is located at 4311 W 800 S, Union Mills, IN 46382 and is currently estimated at $218,230, approximately $202 per square foot. 4311 W 800 S is a home located in LaPorte County with nearby schools including South Central Elementary School and South Central Junior/Senior High School.
Ownership History
Date
Name
Owned For
Owner Type
Purchase Details
Closed on
Apr 6, 2010
Sold by
Sparks Sally L and Hadden Candy
Bought by
Doepping David C and Doepping Donna M
Current Estimated Value
Home Financials for this Owner
Home Financials are based on the most recent Mortgage that was taken out on this home.
Original Mortgage
$69,500
Outstanding Balance
$46,518
Interest Rate
5.1%
Mortgage Type
New Conventional
Estimated Equity
$171,712
Create a Home Valuation Report for This Property
The Home Valuation Report is an in-depth analysis detailing your home's value as well as a comparison with similar homes in the area
Home Values in the Area
Average Home Value in this Area
Purchase History
| Date | Buyer | Sale Price | Title Company |
|---|---|---|---|
| Doepping David C | -- | Meridian Title Corp |
Source: Public Records
Mortgage History
| Date | Status | Borrower | Loan Amount |
|---|---|---|---|
| Open | Doepping David C | $69,500 |
Source: Public Records
Tax History Compared to Growth
Tax History
| Year | Tax Paid | Tax Assessment Tax Assessment Total Assessment is a certain percentage of the fair market value that is determined by local assessors to be the total taxable value of land and additions on the property. | Land | Improvement |
|---|---|---|---|---|
| 2024 | $174 | $125,700 | $16,600 | $109,100 |
| 2022 | $252 | $123,200 | $16,600 | $106,600 |
| 2021 | $129 | $114,100 | $16,600 | $97,500 |
| 2020 | $148 | $114,100 | $16,600 | $97,500 |
| 2019 | $76 | $104,200 | $16,600 | $87,600 |
| 2018 | $193 | $113,800 | $16,600 | $97,200 |
| 2017 | $213 | $115,000 | $16,600 | $98,400 |
| 2016 | $154 | $111,400 | $14,300 | $97,100 |
| 2014 | $240 | $103,500 | $14,300 | $89,200 |
Source: Public Records
Map
Nearby Homes
- 104 N Cummings St
- 210 Union St
- 7052 Long Ln
- 5653 S 425 W
- 6465 W 1100 S
- W 800 S V L
- 11333 S State Road 39
- 5022 S Pine Valley Dr
- BRISCOE Plan at The Cottages of Kingsford Heights
- ASHTON Plan at The Cottages of Kingsford Heights
- 3724 Nordway Rd
- 528 Oxford Rd
- 3719 Nordway Rd
- 522 Oxford Rd
- 3725 Nordway Rd
- 3727 Nordway
- 301 Malvern Rd
- 303 Malvern Rd
- 713 Quintin Ct
- 320 Knox Rd