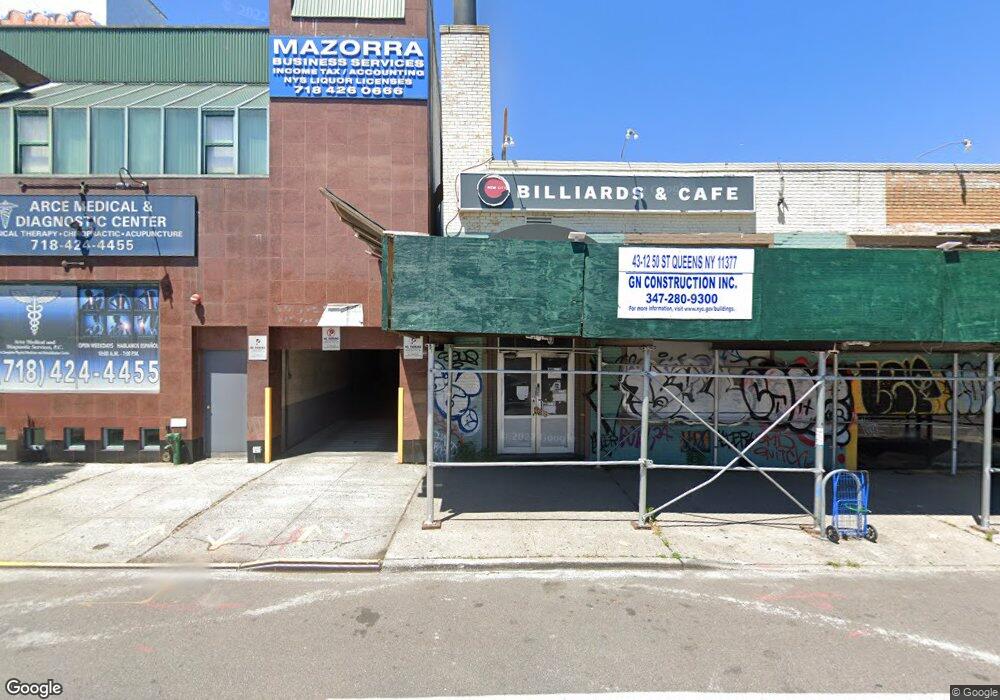
4312 50th St Flushing, NY 11377
Sunnyside NeighborhoodEstimated Value: $7,437,430
--
Bed
--
Bath
20,000
Sq Ft
$372/Sq Ft
Est. Value
About This Home
This home is located at 4312 50th St, Flushing, NY 11377 and is currently estimated at $7,437,430, approximately $371 per square foot. 4312 50th St is a home located in Queens County with nearby schools including P.S. 150Q Sunnyside, William Cullen Bryant High School, and Academy of the City Charter School.
Ownership History
Date
Name
Owned For
Owner Type
Purchase Details
Closed on
May 6, 2025
Sold by
50Th Street Woodside Owner Llc
Bought by
Elmcor Woodside Housing Development Fund
Current Estimated Value
Home Financials for this Owner
Home Financials are based on the most recent Mortgage that was taken out on this home.
Original Mortgage
$27,409,132
Outstanding Balance
$27,315,410
Interest Rate
6.83%
Mortgage Type
Purchase Money Mortgage
Estimated Equity
-$19,877,980
Purchase Details
Closed on
Apr 11, 2022
Sold by
Mdl & S Llc
Bought by
50Th Street Woodside Owner Llc
Home Financials for this Owner
Home Financials are based on the most recent Mortgage that was taken out on this home.
Original Mortgage
$4,675,000
Interest Rate
4.16%
Mortgage Type
Purchase Money Mortgage
Purchase Details
Closed on
Apr 1, 1996
Sold by
Haddad Sarita
Bought by
Mdl & S Llc
Create a Home Valuation Report for This Property
The Home Valuation Report is an in-depth analysis detailing your home's value as well as a comparison with similar homes in the area
Home Values in the Area
Average Home Value in this Area
Purchase History
| Date | Buyer | Sale Price | Title Company |
|---|---|---|---|
| Elmcor Woodside Housing Development Fund | -- | -- | |
| 50Th Street Woodside Owner Llc | $7,000,000 | -- | |
| Mdl & S Llc | $29,500 | First American Title Ins Co | |
| Mdl & S Llc | $29,500 | First American Title Ins Co |
Source: Public Records
Mortgage History
| Date | Status | Borrower | Loan Amount |
|---|---|---|---|
| Open | Elmcor Woodside Housing Development Fund | $27,409,132 | |
| Previous Owner | 50Th Street Woodside Owner Llc | $4,675,000 |
Source: Public Records
Tax History Compared to Growth
Tax History
| Year | Tax Paid | Tax Assessment Tax Assessment Total Assessment is a certain percentage of the fair market value that is determined by local assessors to be the total taxable value of land and additions on the property. | Land | Improvement |
|---|---|---|---|---|
| 2025 | $86,554 | $549,101 | $507,870 | $41,231 |
| 2024 | $86,554 | $817,164 | $489,060 | $328,104 |
| 2023 | $75,574 | $713,502 | $470,250 | $243,252 |
| 2022 | $122,591 | $1,139,850 | $470,250 | $669,600 |
| 2021 | $106,592 | $996,750 | $470,250 | $526,500 |
| 2020 | $115,421 | $1,251,000 | $470,250 | $780,750 |
| 2019 | $106,284 | $1,226,700 | $470,250 | $756,450 |
| 2018 | $96,509 | $917,909 | $254,160 | $663,749 |
| 2017 | $89,147 | $847,889 | $235,350 | $612,539 |
| 2016 | $82,309 | $847,889 | $235,350 | $612,539 |
| 2015 | $34,172 | $762,929 | $235,350 | $527,579 |
| 2014 | $34,172 | $770,539 | $235,350 | $535,189 |
Source: Public Records
Map
Nearby Homes
- 49-07 43rd Ave Unit 7 F
- 43-07 48th St Unit 5B
- 43-07 48th St Unit 5A
- 41-43 49th St
- 5005 43rd Ave Unit 5H
- 43-33 48th St Unit 6 A
- 43-33 48th St Unit 6D
- 43-33 48th St Unit A
- 43-33 48th St Unit 4J
- 4333 48th St Unit 1B
- 4333 48th St Unit 3B
- 4333 48th St Unit 4H
- 4333 48th St Unit 4A
- 4333 48th St Unit 1A
- 4333 48th St Unit 2B
- 4333 48th St Unit 4E
- 4333 48th St Unit 5A
- 4333 48th St Unit 3C
- 41-52 47th St
- 41-31 51st St Unit 7M
- 43-22 50th St Unit 1B
- 43-22 50 St
- 43-22 50th St
- 4916 43rd Ave
- 4322 50th St Unit 2D, 2E
- 4322 50th St
- 4918 43rd Ave
- 4914 43rd Ave
- 4920 43rd Ave Unit 2 floor
- 4920 43rd Ave
- 4912 43rd Ave
- 4912 43rd Ave Unit 3/FL
- 4910 43rd Ave
- 43-17 49th St
- 4908 43rd Ave
- 4317 49th St
- 4906 43rd Ave
- 4904 43rd Ave
- 4321 49th St
- 49-02 43 Ave