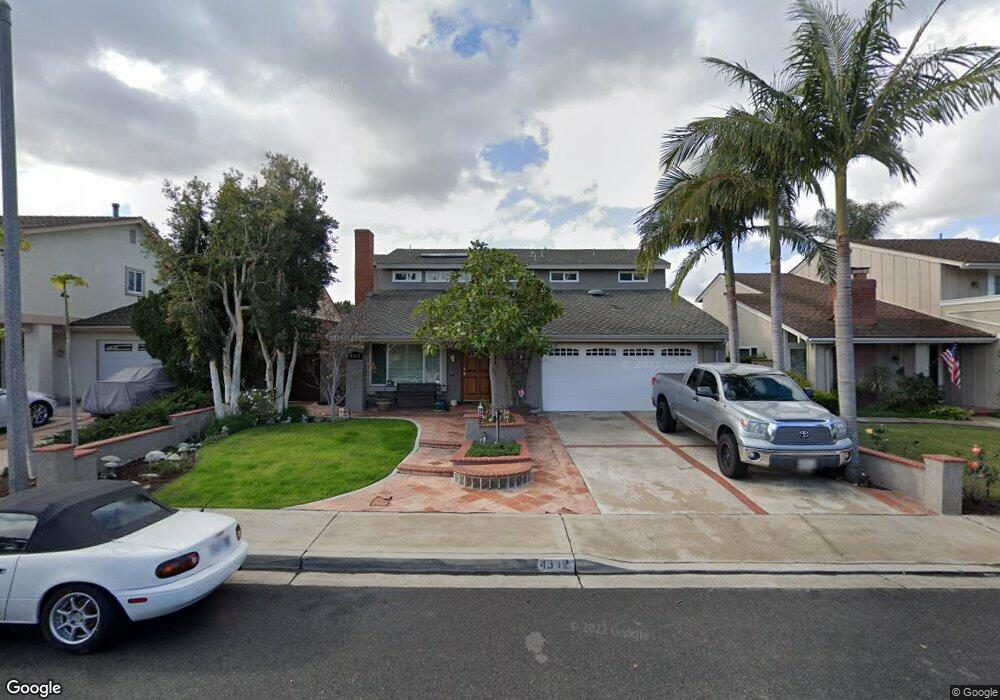
4312 Bridgeway St Irvine, CA 92604
Walnut NeighborhoodEstimated Value: $1,467,000 - $1,656,000
4
Beds
3
Baths
2,474
Sq Ft
$643/Sq Ft
Est. Value
About This Home
This home is located at 4312 Bridgeway St, Irvine, CA 92604 and is currently estimated at $1,589,963, approximately $642 per square foot. 4312 Bridgeway St is a home located in Orange County with nearby schools including Greentree Elementary School, Venado Middle School, and Irvine High School.
Ownership History
Date
Name
Owned For
Owner Type
Purchase Details
Closed on
Apr 6, 2012
Sold by
Thompson Daniel P and Mech Natika O
Bought by
Thompson Daniel P and Mech Natika O
Current Estimated Value
Home Financials for this Owner
Home Financials are based on the most recent Mortgage that was taken out on this home.
Original Mortgage
$417,000
Outstanding Balance
$56,360
Interest Rate
3.9%
Mortgage Type
New Conventional
Estimated Equity
$1,533,603
Purchase Details
Closed on
Apr 17, 2011
Sold by
Thompson Daniel P and Mech Natika O
Bought by
Thompson Daniel P and Mech Natika O
Purchase Details
Closed on
Jul 9, 2003
Sold by
Chiampi James T
Bought by
Lin Elton and Chang Christine
Purchase Details
Closed on
Jul 14, 1999
Sold by
Wang Shyan Daw J and Wang Min C
Bought by
Thompson Daniel Paul and Mech Natika O
Home Financials for this Owner
Home Financials are based on the most recent Mortgage that was taken out on this home.
Original Mortgage
$268,000
Interest Rate
7.56%
Purchase Details
Closed on
Jan 31, 1996
Sold by
Wang Shyan Daw J and Wang Hsiu Min C
Bought by
Wang Shyan Daw J and Wang Hsiu Min C
Create a Home Valuation Report for This Property
The Home Valuation Report is an in-depth analysis detailing your home's value as well as a comparison with similar homes in the area
Home Values in the Area
Average Home Value in this Area
Purchase History
We collect this data history from publicly available records. To have your information removed, we recommend requesting removal directly through your county’s website.
| Date | Buyer | Sale Price | Title Company |
|---|---|---|---|
| Thompson Daniel P | -- | Ticor Title Co | |
| Thompson Daniel P | -- | Ticor Title Co | |
| Thompson Daniel P | -- | None Available | |
| Thompson Daniel P | -- | None Available | |
| Lin Elton | $316,000 | Equity Title Company | |
| Thompson Daniel Paul | $335,000 | -- | |
| Wang Shyan Daw J | -- | -- |
Source: Public Records
Mortgage History
We collect this data history from publicly available records. To have your information removed, we recommend requesting removal directly through your county’s website.
| Date | Status | Borrower | Loan Amount |
|---|---|---|---|
| Open | Thompson Daniel P | $417,000 | |
| Previous Owner | Thompson Daniel Paul | $268,000 | |
| Closed | Thompson Daniel Paul | $16,700 |
Source: Public Records
Tax History
| Year | Tax Paid | Tax Assessment Tax Assessment Total Assessment is a certain percentage of the fair market value that is determined by local assessors to be the total taxable value of land and additions on the property. | Land | Improvement |
|---|---|---|---|---|
| 2025 | $5,637 | $540,997 | $332,467 | $208,530 |
| 2024 | $5,637 | $530,390 | $325,948 | $204,442 |
| 2023 | $5,490 | $519,991 | $319,557 | $200,434 |
| 2022 | $5,382 | $509,796 | $313,292 | $196,504 |
| 2021 | $5,257 | $499,800 | $307,149 | $192,651 |
| 2020 | $5,227 | $494,676 | $304,000 | $190,676 |
| 2019 | $5,110 | $484,977 | $298,039 | $186,938 |
| 2018 | $5,017 | $475,468 | $292,195 | $183,273 |
| 2017 | $4,913 | $466,146 | $286,466 | $179,680 |
| 2016 | $4,696 | $457,006 | $280,849 | $176,157 |
| 2015 | $4,572 | $450,142 | $276,631 | $173,511 |
| 2014 | $4,482 | $441,325 | $271,212 | $170,113 |
Source: Public Records
Map
Nearby Homes
- 4122 Loma St
- 4512 Robinwood Cir
- 4141 Pleasant St
- 14781 Deer Park St
- 3981 Cedron St
- 4652 Charnock Dr
- 14612 Mulberry Ave
- 9 Badger Pass
- 12 Silverwood Unit 19
- 3852 Faulkner Ct
- 13 Sunflower
- 14272 Saarinen Ct
- 25 Cheyenne Unit 68
- 14801 Mayten Ave
- 4881 Winvale Ave
- 178 Monroe
- 4862 Gainsport Cir
- 26 Helena Unit 69
- 198 Monroe Unit 147
- 3672 Blackthorn St
- 4291 Bridgeway St
- 4301 Bridgeway St
- 4281 Bridgeway St
- 4292 Vale St
- 4311 Bridgeway St
- 4271 Bridgeway St
- 4302 Vale St
- 4282 Vale St
- 4272 Vale St
- 4312 Vale St
- 4261 Bridgeway St
- 4321 Bridgeway St
- 4292 Bridgeway St
- 4302 Bridgeway St
- 4282 Bridgeway St
- 4262 Vale St
- 4322 Vale St
- 4272 Bridgeway St
- 4331 Bridgeway St
- 4322 Bridgeway St
Your Personal Tour Guide
Ask me questions while you tour the home.