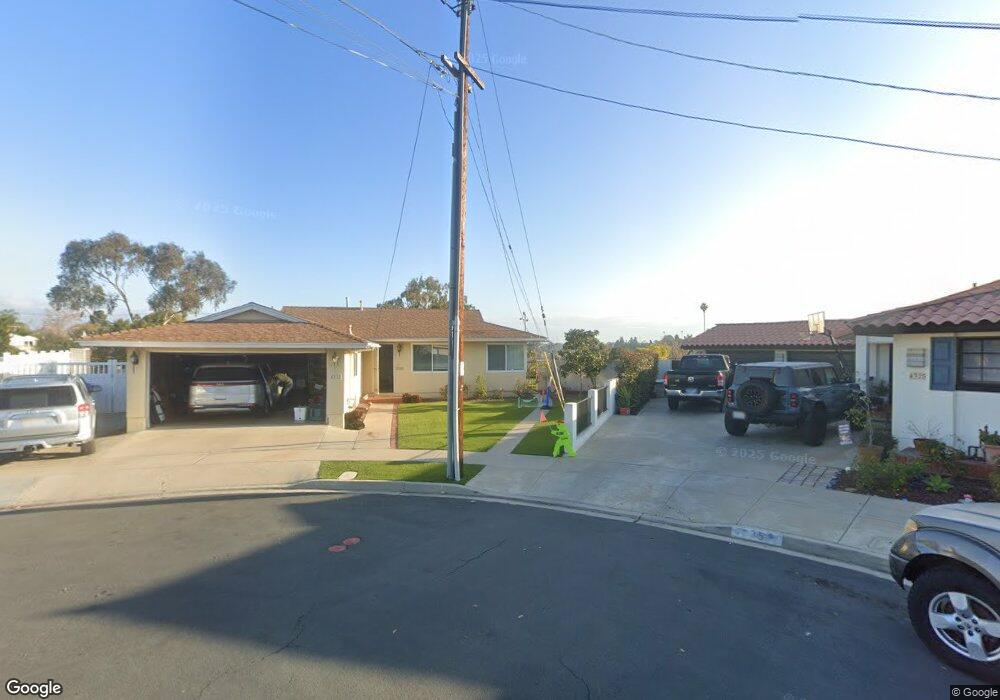
4312 Cindy St San Diego, CA 92117
North Clairemont NeighborhoodEstimated Value: $944,882 - $1,179,000
3
Beds
2
Baths
1,050
Sq Ft
$994/Sq Ft
Est. Value
About This Home
This home is located at 4312 Cindy St, San Diego, CA 92117 and is currently estimated at $1,044,221, approximately $994 per square foot. 4312 Cindy St is a home located in San Diego County with nearby schools including Field Elementary School, Innovation Middle School, and Madison High School.
Ownership History
Date
Name
Owned For
Owner Type
Purchase Details
Closed on
Aug 12, 2020
Sold by
Garcia Anthony C and Garcia Nan T
Bought by
Garcia Anthony G and Garcia Nan T
Current Estimated Value
Purchase Details
Closed on
Jun 21, 2018
Sold by
Garcia Anthony G
Bought by
Garcia Anthony G and Garcia Nan Teresa
Purchase Details
Closed on
Aug 2, 1995
Sold by
Garcia Emiterio and Garcia Ramona R
Bought by
Garcia Emiterio and Garcia Ramona R
Create a Home Valuation Report for This Property
The Home Valuation Report is an in-depth analysis detailing your home's value as well as a comparison with similar homes in the area
Home Values in the Area
Average Home Value in this Area
Purchase History
| Date | Buyer | Sale Price | Title Company |
|---|---|---|---|
| Garcia Anthony G | -- | None Available | |
| Garcia Anthony G | -- | None Available | |
| Garcia Anthony G | -- | None Available | |
| Garcia Emiterio | -- | -- |
Source: Public Records
Tax History Compared to Growth
Tax History
| Year | Tax Paid | Tax Assessment Tax Assessment Total Assessment is a certain percentage of the fair market value that is determined by local assessors to be the total taxable value of land and additions on the property. | Land | Improvement |
|---|---|---|---|---|
| 2025 | $727 | $57,462 | $21,451 | $36,011 |
| 2024 | $727 | $56,336 | $21,031 | $35,305 |
| 2023 | $710 | $55,232 | $20,619 | $34,613 |
| 2022 | $692 | $54,150 | $20,215 | $33,935 |
| 2021 | $687 | $53,089 | $19,819 | $33,270 |
| 2020 | $679 | $52,545 | $19,616 | $32,929 |
| 2019 | $668 | $612,000 | $530,400 | $81,600 |
| 2018 | $626 | $50,506 | $18,855 | $31,651 |
| 2017 | $81 | $49,517 | $18,486 | $31,031 |
| 2016 | $517 | $48,547 | $18,124 | $30,423 |
| 2015 | $509 | $47,819 | $17,852 | $29,967 |
| 2014 | $501 | $46,883 | $17,503 | $29,380 |
Source: Public Records
Map
Nearby Homes
- 4587 Rolfe Rd
- 4472 Mount Lindsey Ave
- 4380 Rolfe Rd
- 4182 Seri St
- 4527 Chinook Ct
- 4203 Tolowa St
- 4576 Onondaga Ave
- 4772 Mount Gaywas Dr
- 4226 Mount Voss Dr
- 4501 Bannock Ave
- 4915 Mount Gaywas Dr
- 4509 Manitou Way
- 4401-3 Clairemont Mesa Blvd
- 4951 57 Genesee Ave
- 4781 Boise Ave
- 4851 Cole St Unit 1
- 4813 Boise Ave
- 3582 Hatteras Ave
- 4875 Cole St Unit 69
- 4875 Cole St Unit 51