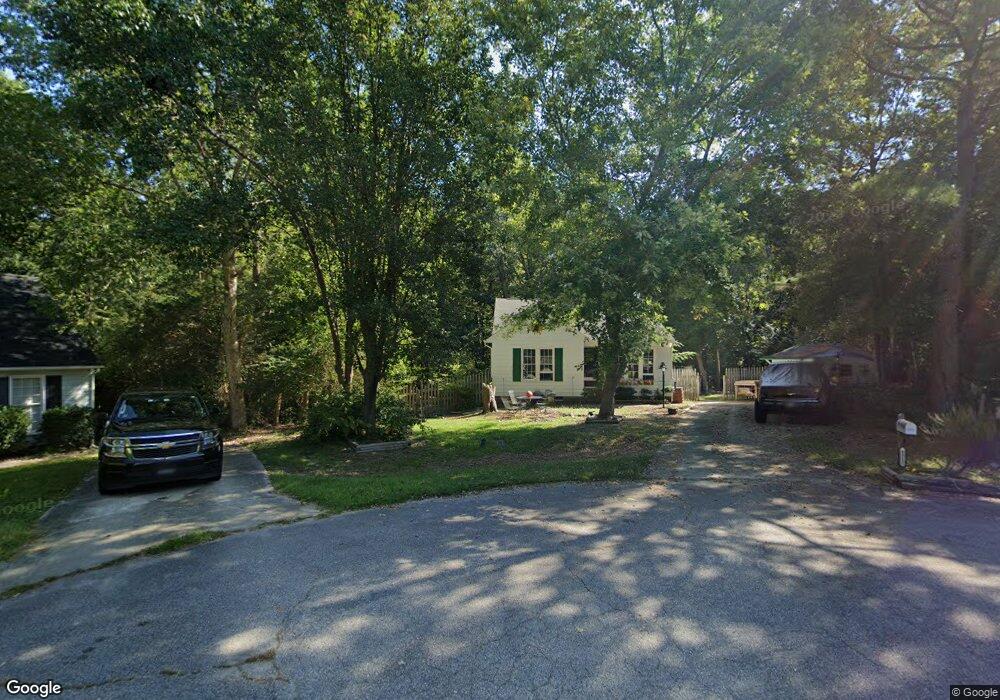
4312 Puffin Place Raleigh, NC 27616
Estimated Value: $285,597 - $300,000
--
Bed
2
Baths
1,272
Sq Ft
$230/Sq Ft
Est. Value
About This Home
This home is located at 4312 Puffin Place, Raleigh, NC 27616 and is currently estimated at $293,149, approximately $230 per square foot. 4312 Puffin Place is a home located in Wake County with nearby schools including Forestville Road Elementary School, Neuse River Middle School, and Knightdale High.
Ownership History
Date
Name
Owned For
Owner Type
Purchase Details
Closed on
Feb 23, 2007
Sold by
Bloom Robin Jean
Bought by
Thomson Robin Jean
Current Estimated Value
Home Financials for this Owner
Home Financials are based on the most recent Mortgage that was taken out on this home.
Original Mortgage
$100,000
Outstanding Balance
$11,785
Interest Rate
6.16%
Mortgage Type
Purchase Money Mortgage
Estimated Equity
$281,364
Purchase Details
Closed on
Apr 21, 2005
Sold by
Bloom Robin Jean and Thomson Robin Jean
Bought by
Bloom Robin Jean
Home Financials for this Owner
Home Financials are based on the most recent Mortgage that was taken out on this home.
Original Mortgage
$48,650
Interest Rate
5.79%
Mortgage Type
New Conventional
Purchase Details
Closed on
Feb 17, 1994
Bought by
Thomson Robin Jean
Create a Home Valuation Report for This Property
The Home Valuation Report is an in-depth analysis detailing your home's value as well as a comparison with similar homes in the area
Home Values in the Area
Average Home Value in this Area
Purchase History
| Date | Buyer | Sale Price | Title Company |
|---|---|---|---|
| Thomson Robin Jean | -- | None Available | |
| Bloom Robin Jean | -- | -- | |
| Thomson Robin Jean | $81,000 | -- |
Source: Public Records
Mortgage History
| Date | Status | Borrower | Loan Amount |
|---|---|---|---|
| Open | Thomson Robin Jean | $100,000 | |
| Previous Owner | Bloom Robin Jean | $48,650 |
Source: Public Records
Tax History Compared to Growth
Tax History
| Year | Tax Paid | Tax Assessment Tax Assessment Total Assessment is a certain percentage of the fair market value that is determined by local assessors to be the total taxable value of land and additions on the property. | Land | Improvement |
|---|---|---|---|---|
| 2025 | $1,701 | $262,867 | $80,000 | $182,867 |
| 2024 | $1,652 | $262,867 | $80,000 | $182,867 |
| 2023 | $1,358 | $171,635 | $35,000 | $136,635 |
| 2022 | $1,260 | $171,635 | $35,000 | $136,635 |
| 2021 | $1,226 | $171,635 | $35,000 | $136,635 |
| 2020 | $1,206 | $171,635 | $35,000 | $136,635 |
| 2019 | $1,103 | $132,574 | $38,000 | $94,574 |
| 2018 | $1,015 | $132,574 | $38,000 | $94,574 |
| 2017 | $963 | $132,574 | $38,000 | $94,574 |
| 2016 | $943 | $132,574 | $38,000 | $94,574 |
| 2015 | $905 | $127,409 | $28,000 | $99,409 |
| 2014 | $858 | $127,409 | $28,000 | $99,409 |
Source: Public Records
Map
Nearby Homes
- 4317 Snow Goose Ct
- 2028 Ruddy Rd
- 4457 Labrador Dr
- 4208 Bluewing Rd
- 4004 Mount Moran Rd
- 7817 Elmshire Way
- 3917 Mount Moran Rd
- 7727 Weathered Oak Way
- 7725 Weathered Oak Way
- 3932 Mount Moran Rd
- 7661 Mapleshire Dr
- 4356 Coldwater Springs Dr
- 2108 Brilliant Dr
- 4348 Coldwater Springs Dr
- 4344 Coldwater Springs Dr
- 7636 Birchmoor Way
- 4345 Coldwater Springs Dr
- 2616 Lizei St
- 4340 Coldwater Springs Dr
- 4341 Coldwater Springs Dr
- 4309 Puffin Place
- 4308 Puffin Place
- 4305 Puffin Place
- 4304 Puffin Place
- 2104 Bufflehead Rd
- 2112 Bufflehead Rd
- 4312 Scaup Ct
- 4316 Scaup Ct
- 4308 Scaup Ct
- 4300 Scaup Ct
- 2105 Bufflehead Rd
- 4216 Loon Ln
- 4317 Scaup Ct
- 4309 Snow Goose Ct
- 4313 Snow Goose Ct
- 2125 Ruddy Rd
- 2129 Ruddy Rd
- 4309 Scaup Ct
- 4305 Scaup Ct
- 2121 Ruddy Rd