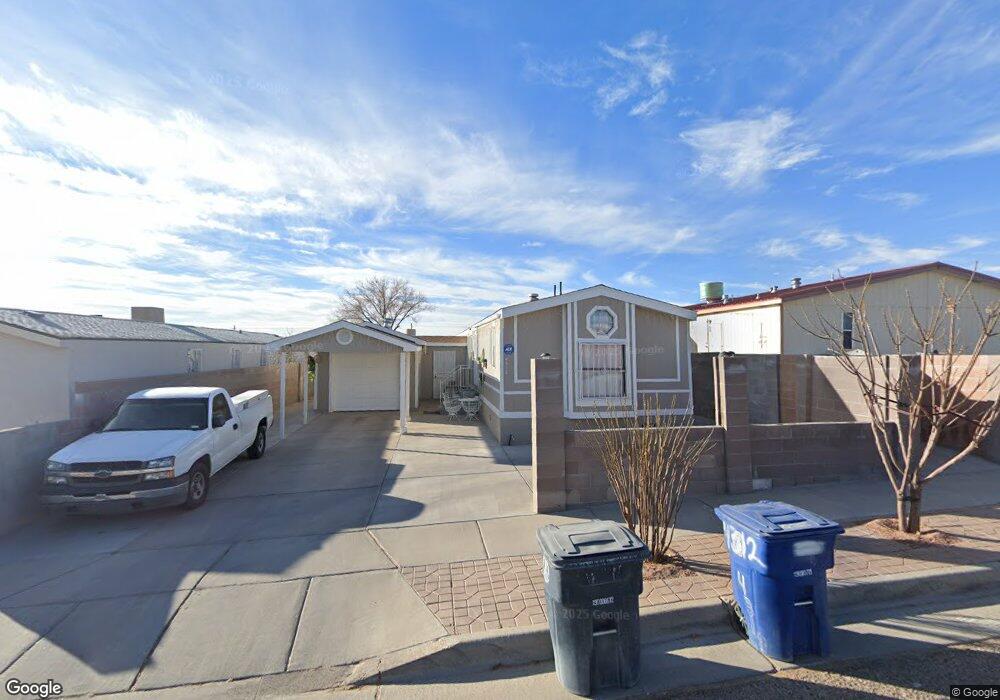
4312 Rocky Rd SW Albuquerque, NM 87121
Southwest Heights NeighborhoodEstimated Value: $264,000 - $279,000
3
Beds
2
Baths
1,178
Sq Ft
$231/Sq Ft
Est. Value
About This Home
This home is located at 4312 Rocky Rd SW, Albuquerque, NM 87121 and is currently estimated at $271,581, approximately $230 per square foot. 4312 Rocky Rd SW is a home located in Bernalillo County with nearby schools including Adobe Acres Elementary School, Harrison Middle School, and Rio Grande High School.
Ownership History
Date
Name
Owned For
Owner Type
Purchase Details
Closed on
Feb 28, 2022
Sold by
Reyes Flores Jr I
Bought by
Ramos Juan Ramon and Requenes Luciela
Current Estimated Value
Purchase Details
Closed on
Jun 29, 2006
Sold by
Pohlman Lane E
Bought by
Flores Reyes
Home Financials for this Owner
Home Financials are based on the most recent Mortgage that was taken out on this home.
Original Mortgage
$70,887
Interest Rate
6.58%
Mortgage Type
FHA
Purchase Details
Closed on
Oct 28, 2005
Sold by
Griego Santiago P and Griego Mary V
Bought by
Pohlman Lane E
Purchase Details
Closed on
Jan 31, 2000
Sold by
Carnes Melvin Blake Road Partnership
Bought by
Greigo Santiago P and Greigo Mary
Home Financials for this Owner
Home Financials are based on the most recent Mortgage that was taken out on this home.
Original Mortgage
$37,400
Interest Rate
7.95%
Mortgage Type
Purchase Money Mortgage
Create a Home Valuation Report for This Property
The Home Valuation Report is an in-depth analysis detailing your home's value as well as a comparison with similar homes in the area
Home Values in the Area
Average Home Value in this Area
Purchase History
| Date | Buyer | Sale Price | Title Company |
|---|---|---|---|
| Ramos Juan Ramon | -- | None Listed On Document | |
| Flores Reyes | -- | Fidelity National Title Co | |
| Pohlman Lane E | -- | First American Title Ins Co | |
| Greigo Santiago P | -- | Fidelity National Title Ins |
Source: Public Records
Mortgage History
| Date | Status | Borrower | Loan Amount |
|---|---|---|---|
| Previous Owner | Flores Reyes | $70,887 | |
| Previous Owner | Greigo Santiago P | $37,400 |
Source: Public Records
Tax History Compared to Growth
Tax History
| Year | Tax Paid | Tax Assessment Tax Assessment Total Assessment is a certain percentage of the fair market value that is determined by local assessors to be the total taxable value of land and additions on the property. | Land | Improvement |
|---|---|---|---|---|
| 2025 | $1,758 | $44,978 | $11,280 | $33,698 |
| 2024 | $1,758 | $43,667 | $10,951 | $32,716 |
| 2023 | $1,726 | $42,395 | $10,632 | $31,763 |
| 2022 | $1,016 | $25,884 | $11,280 | $14,604 |
| 2021 | $1,064 | $25,129 | $10,951 | $14,178 |
| 2020 | $1,047 | $24,397 | $10,632 | $13,765 |
| 2019 | $1,044 | $24,340 | $10,951 | $13,389 |
| 2018 | $1,007 | $24,340 | $10,951 | $13,389 |
| 2017 | $1,005 | $23,631 | $10,632 | $12,999 |
| 2016 | $1,011 | $23,764 | $10,632 | $13,132 |
| 2015 | $23,764 | $23,764 | $10,632 | $13,132 |
| 2014 | $1,016 | $23,931 | $10,632 | $13,299 |
| 2013 | -- | $23,931 | $10,632 | $13,299 |
Source: Public Records
Map
Nearby Homes
- 4301 Blake Trailer 40 Rd SW
- 8524 Stony Creek Rd SW
- 2503 Sancho Panza Way SW
- 2771 Butch Cassidy Dr SW
- 2724 Barcelona Place SW
- 3855 Villa Serena Place SW
- 7901 Purple Fringe Rd SW
- 7814 Desert Canyon Place SW
- 8600 Kimela Ct SW
- 1420 Summerfield Place SW
- 3201 Mata Ortiz Dr SW
- 2528 Coors Blvd SW
- 9808 Morning Sun Trail SW
- 9801 Sun Chaser Trail SW Unit 1
- 9901 Morning Sun Trail SW
- 1815 Shadetree Dr SW
- 7304 Autumn Sky Rd SW
- 8909 Indigo Sky Trail SW
- 8912 Indigo Sky Trail SW
- 9909 Saddlehorn Trail SW
- 2724 Wendell Rd SW
- 4308 Rocky Rd SW
- 4304 Rocky Rd SW
- 2732 Wendell Rd SW
- 4309 Ruger Rd SW
- 4305 Ruger Rd SW
- 4300 Rocky Rd SW
- 4315 Rocky Rd SW
- 2716 Wendell Rd SW
- 4309 Rocky Rd SW
- 4301 Ruger Rd SW
- 4301 Rocky Rd SW
- 2753 Wendell Rd SW
- 4312 Ruger Rd SW
- 2708 Wendell Rd SW
- 4308 Riley Rd SW
- 4312 Riley Rd SW
- 2729 Wendell Rd SW
- 2728 Katrina Dr SW
- 4304 Ruger Rd SW