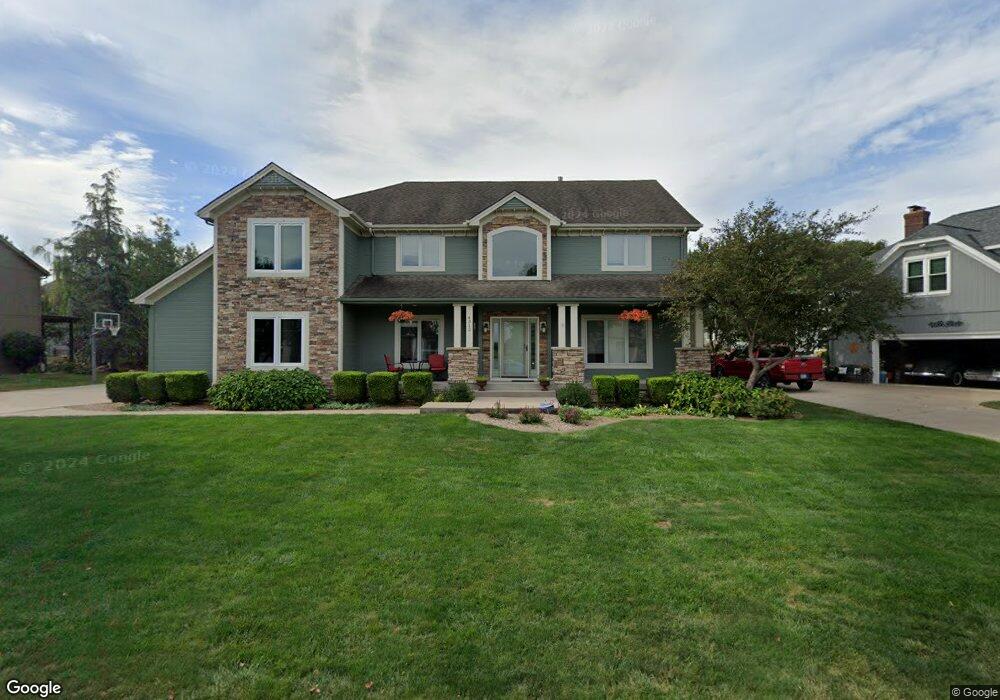
4312 SW Gull Point Dr Lees Summit, MO 64082
Estimated Value: $480,000 - $615,000
4
Beds
4
Baths
3,316
Sq Ft
$170/Sq Ft
Est. Value
About This Home
This home is located at 4312 SW Gull Point Dr, Lees Summit, MO 64082 and is currently estimated at $562,484, approximately $169 per square foot. 4312 SW Gull Point Dr is a home located in Jackson County with nearby schools including Trailridge Elementary School, Summit Lakes Middle School, and Lee's Summit West High School.
Ownership History
Date
Name
Owned For
Owner Type
Purchase Details
Closed on
Nov 29, 2022
Sold by
Dimarco Joseph P and Dimarco Nicola L
Bought by
Dimarco Joint Trust
Current Estimated Value
Purchase Details
Closed on
Jan 25, 2002
Sold by
Dimercurio Paul and Dimercurio Bridget
Bought by
Dimarco Joseph P and Dimarco Nicola L
Home Financials for this Owner
Home Financials are based on the most recent Mortgage that was taken out on this home.
Original Mortgage
$44,800
Interest Rate
6.53%
Mortgage Type
Purchase Money Mortgage
Purchase Details
Closed on
Oct 27, 2000
Sold by
Raintree Lake Corp
Bought by
Dimercurio Paul and Dimercurio Bridget
Home Financials for this Owner
Home Financials are based on the most recent Mortgage that was taken out on this home.
Original Mortgage
$30,599
Interest Rate
7.84%
Mortgage Type
Purchase Money Mortgage
Create a Home Valuation Report for This Property
The Home Valuation Report is an in-depth analysis detailing your home's value as well as a comparison with similar homes in the area
Home Values in the Area
Average Home Value in this Area
Purchase History
| Date | Buyer | Sale Price | Title Company |
|---|---|---|---|
| Dimarco Joint Trust | -- | -- | |
| Dimarco Joseph P | -- | -- | |
| Dimercurio Paul | -- | Security Land Title Co |
Source: Public Records
Mortgage History
| Date | Status | Borrower | Loan Amount |
|---|---|---|---|
| Previous Owner | Dimarco Joseph P | $44,800 | |
| Previous Owner | Dimercurio Paul | $30,599 |
Source: Public Records
Tax History Compared to Growth
Tax History
| Year | Tax Paid | Tax Assessment Tax Assessment Total Assessment is a certain percentage of the fair market value that is determined by local assessors to be the total taxable value of land and additions on the property. | Land | Improvement |
|---|---|---|---|---|
| 2025 | $6,860 | $108,188 | $14,801 | $93,387 |
| 2024 | $6,810 | $95,000 | $10,716 | $84,284 |
| 2023 | $6,810 | $95,000 | $10,716 | $84,284 |
| 2022 | $6,657 | $82,460 | $11,677 | $70,783 |
| 2021 | $6,794 | $82,460 | $11,677 | $70,783 |
| 2020 | $6,529 | $78,461 | $11,677 | $66,784 |
| 2019 | $6,350 | $78,461 | $11,677 | $66,784 |
| 2018 | $1,041,327 | $68,287 | $10,163 | $58,124 |
| 2017 | $5,956 | $68,287 | $10,163 | $58,124 |
| 2016 | $5,970 | $67,754 | $10,716 | $57,038 |
| 2014 | $6,117 | $68,053 | $10,024 | $58,029 |
Source: Public Records
Map
Nearby Homes
- 4605 SW Olympia Cir
- 4400 SW Rivulet Dr
- 4641 SW Soldier Dr
- 732 SW Raintree Dr
- 4600 SW Admiral Byrd Dr
- 1022 SW Cheshire Dr
- 514 SW Raintree Dr
- 1021 SW Cheshire Dr
- 4647 SW Olympia Place
- 4528 SW Berkshire Dr
- 4520 SW Berkshire Dr
- 501 SW Stacey Dr
- 4624 SW Robinson Dr
- 4628 SW Robinson Dr
- 4120 SW Flintrock Dr
- 3921 SW Windemere Dr
- 4510 SW Fenwick Rd
- 917 SW Soldier Ct
- 1208 SW Neelie Ln
- 4004 SW Evergreen Ln
- 4308 SW Gull Point Dr
- 4316 SW Gull Point Dr
- 4313 SW Gull Point Dr
- 4305 SW Gull Point Dr
- 4317 SW Gull Point Dr
- 4320 SW Gull Point Dr
- 4404 SW Admiral Byrd Dr
- 4321 SW Gull Point Dr
- 901 SW Raintree Dr
- 905 SW Raintree Dr
- 869 SW Raintree Dr
- 4408 SW Admiral Byrd Dr
- 909 SW Raintree Dr
- 4325 SW Gull Point Dr
- 904 SW Raintree Dr
- 900 SW Raintree Dr
- 913 SW Raintree Dr
- 872 SW Raintree Dr
- 865 SW Raintree Dr
- 4405 SW Admiral Byrd Dr