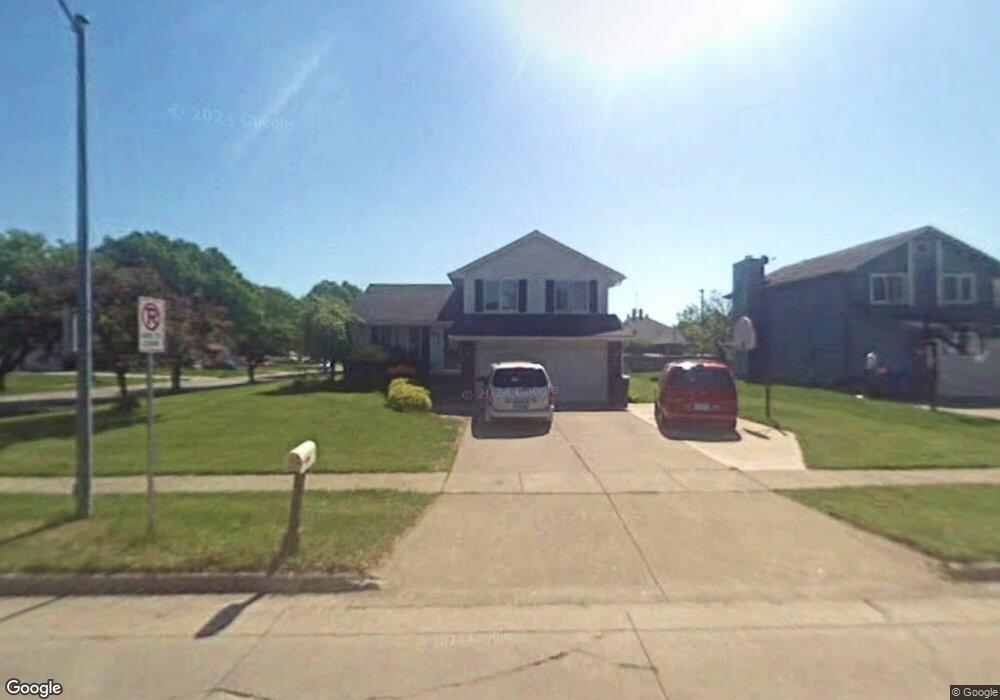
4313 46th St Des Moines, IA 50310
Meredith NeighborhoodEstimated Value: $307,439 - $330,000
--
Bed
3
Baths
1,464
Sq Ft
$216/Sq Ft
Est. Value
About This Home
This home is located at 4313 46th St, Des Moines, IA 50310 and is currently estimated at $316,860, approximately $216 per square foot. 4313 46th St is a home located in Polk County with nearby schools including Lawson Elementary School, Johnston Middle School, and Summit Middle School.
Ownership History
Date
Name
Owned For
Owner Type
Purchase Details
Closed on
Dec 19, 2002
Sold by
Hansen Timothy C and Hansen Lauren
Bought by
Dang Qui Phu and Bui Trang Xuan
Current Estimated Value
Home Financials for this Owner
Home Financials are based on the most recent Mortgage that was taken out on this home.
Original Mortgage
$112,000
Outstanding Balance
$47,313
Interest Rate
6.01%
Estimated Equity
$269,547
Purchase Details
Closed on
Dec 26, 2000
Sold by
Young Gary Wayne and Young Connie L
Bought by
Hansen Timothy C
Home Financials for this Owner
Home Financials are based on the most recent Mortgage that was taken out on this home.
Original Mortgage
$104,000
Interest Rate
7.8%
Purchase Details
Closed on
Mar 17, 1999
Sold by
Young Gary W
Bought by
Young Gary W and Young Connie L
Create a Home Valuation Report for This Property
The Home Valuation Report is an in-depth analysis detailing your home's value as well as a comparison with similar homes in the area
Home Values in the Area
Average Home Value in this Area
Purchase History
| Date | Buyer | Sale Price | Title Company |
|---|---|---|---|
| Dang Qui Phu | $142,500 | -- | |
| Hansen Timothy C | $129,500 | -- | |
| Young Gary W | -- | -- |
Source: Public Records
Mortgage History
| Date | Status | Borrower | Loan Amount |
|---|---|---|---|
| Open | Dang Qui Phu | $112,000 | |
| Previous Owner | Hansen Timothy C | $104,000 |
Source: Public Records
Tax History Compared to Growth
Tax History
| Year | Tax Paid | Tax Assessment Tax Assessment Total Assessment is a certain percentage of the fair market value that is determined by local assessors to be the total taxable value of land and additions on the property. | Land | Improvement |
|---|---|---|---|---|
| 2025 | $5,018 | $295,800 | $56,400 | $239,400 |
| 2024 | $5,018 | $259,900 | $48,800 | $211,100 |
| 2023 | $5,074 | $259,900 | $48,800 | $211,100 |
| 2022 | $5,596 | $226,600 | $43,500 | $183,100 |
| 2021 | $5,484 | $226,600 | $43,500 | $183,100 |
| 2020 | $5,386 | $211,600 | $40,700 | $170,900 |
| 2019 | $5,058 | $211,600 | $40,700 | $170,900 |
| 2018 | $5,006 | $189,200 | $35,600 | $153,600 |
| 2017 | $4,672 | $189,200 | $35,600 | $153,600 |
| 2016 | $4,560 | $173,600 | $32,400 | $141,200 |
| 2015 | $4,560 | $173,600 | $32,400 | $141,200 |
| 2014 | $4,066 | $153,300 | $28,600 | $124,700 |
Source: Public Records
Map
Nearby Homes