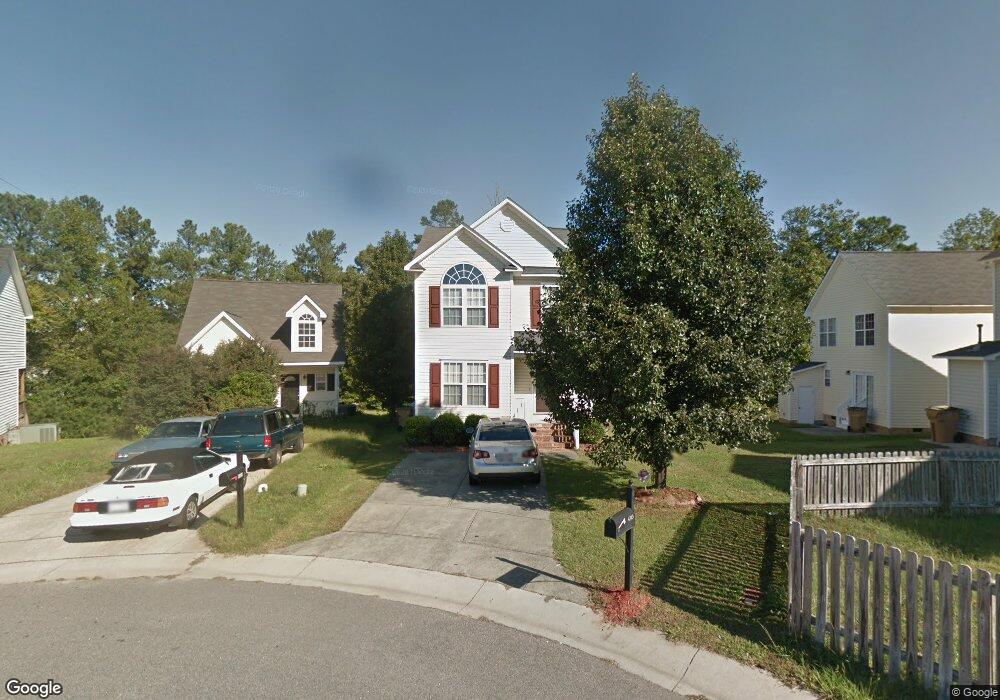
4313 Windlass Ct Raleigh, NC 27616
Northeast Raleigh NeighborhoodEstimated Value: $246,000 - $279,000
3
Beds
3
Baths
1,192
Sq Ft
$223/Sq Ft
Est. Value
About This Home
This home is located at 4313 Windlass Ct, Raleigh, NC 27616 and is currently estimated at $265,346, approximately $222 per square foot. 4313 Windlass Ct is a home located in Wake County with nearby schools including River Bend Elementary, River Bend Middle, and Rolesville High School.
Ownership History
Date
Name
Owned For
Owner Type
Purchase Details
Closed on
Aug 31, 2016
Sold by
Alberitton Lakendrell and Alberitton Klarissa
Bought by
Shehzadi Mishad and Ansar Sohail
Current Estimated Value
Purchase Details
Closed on
Nov 27, 2006
Sold by
Atkinson Dee M
Bought by
Bynum Klarissa
Home Financials for this Owner
Home Financials are based on the most recent Mortgage that was taken out on this home.
Original Mortgage
$5,000
Interest Rate
6.31%
Mortgage Type
Unknown
Purchase Details
Closed on
Nov 30, 2000
Sold by
Coleman Ronald Alan and Coleman Robin H
Bought by
Atkinson Dee M
Home Financials for this Owner
Home Financials are based on the most recent Mortgage that was taken out on this home.
Original Mortgage
$89,750
Interest Rate
7.82%
Mortgage Type
FHA
Purchase Details
Closed on
Sep 12, 2000
Sold by
Carlton Group Of North Carolina Llc
Bought by
Coleman Ronald Alan
Create a Home Valuation Report for This Property
The Home Valuation Report is an in-depth analysis detailing your home's value as well as a comparison with similar homes in the area
Home Values in the Area
Average Home Value in this Area
Purchase History
| Date | Buyer | Sale Price | Title Company |
|---|---|---|---|
| Shehzadi Mishad | $131,000 | None Available | |
| Bynum Klarissa | $119,000 | None Available | |
| Atkinson Dee M | $103,000 | -- | |
| Coleman Ronald Alan | $50,000 | -- |
Source: Public Records
Mortgage History
| Date | Status | Borrower | Loan Amount |
|---|---|---|---|
| Previous Owner | Bynum Klarissa | $5,000 | |
| Previous Owner | Bynum Klarissa | $90,311 | |
| Previous Owner | Bynum Klarissa | $7,000 | |
| Previous Owner | Atkinson Dee M | $89,750 | |
| Closed | Atkinson Dee M | $13,200 |
Source: Public Records
Tax History
| Year | Tax Paid | Tax Assessment Tax Assessment Total Assessment is a certain percentage of the fair market value that is determined by local assessors to be the total taxable value of land and additions on the property. | Land | Improvement |
|---|---|---|---|---|
| 2025 | $2,470 | $280,907 | $90,000 | $190,907 |
| 2024 | $2,460 | $280,907 | $90,000 | $190,907 |
Source: Public Records
Map
Nearby Homes
- 4332 Woodlawn Dr
- 4324 Woodlawn Dr
- 4729 Windbreak Ln
- 4205 Reddington Trail
- 4522 Centrebrook Cir
- 4701 Tommans Trail
- 4200 James Rd
- 4217 James Rd
- 4604 Lavista Ct Unit A & B
- 4106 N New Hope Rd
- 4200 James
- 4225 Fowler Ridge Dr
- 4737 Waterford Cove Dr
- 5009 Marathon Ln
- 3852 Old Coach Rd
- 4500 Rivershyre Way
- 4715 Mallory Ct
- 4809 Kaycee Ct
- 4908 Jelynn St
- 5016 Kyle Dr
- 4309 Windlass Ct
- 4921 Windsprint Way
- 4917 Windsprint Way
- 4305 Windlass Ct
- 4913 Windsprint Way
- 4301 Windlass Ct
- 4300 Windlass Ct
- 4304 Windlass Ct
- LOT 46 Windsprint Way
- lot 62 Windsprint Way
- LOT 61 Windsprint Way
- 4312 Windlass Ct
- 4316 Windlass Ct
- 4308 Windlass Ct
- 4320 Windlass Ct
- 4920 Windsprint Way
- 4916 Windsprint Way
- 4912 Windsprint Way
- 4908 Windsprint Way
- 4904 Windsprint Way
Your Personal Tour Guide
Ask me questions while you tour the home.