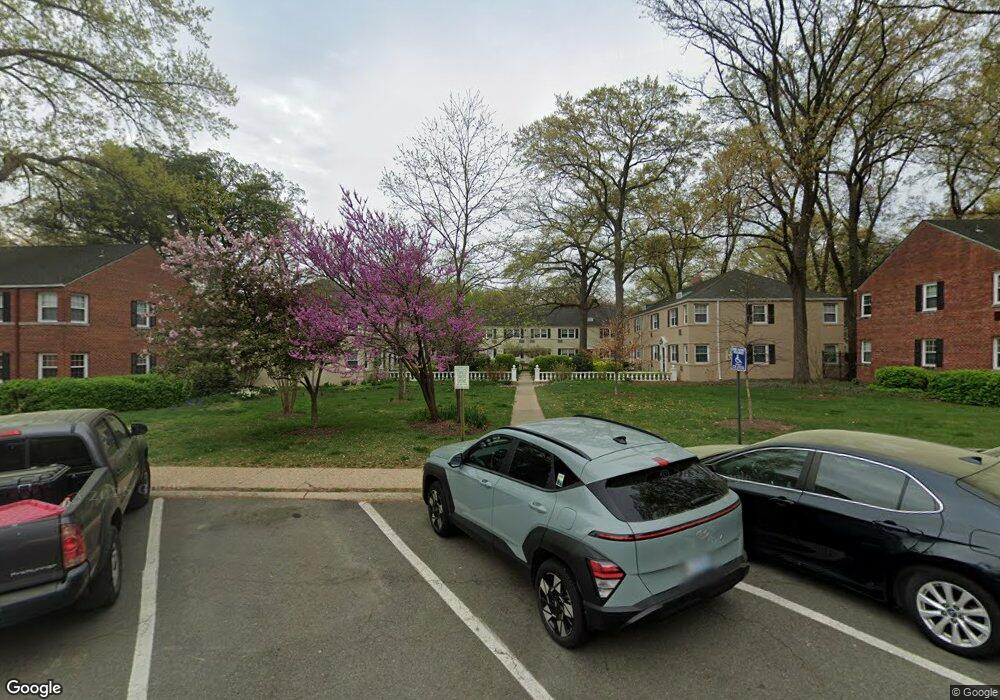
4314 N Pershing Dr Unit 43141 Arlington, VA 22203
Buckingham NeighborhoodEstimated Value: $327,000 - $344,000
2
Beds
1
Bath
894
Sq Ft
$376/Sq Ft
Est. Value
About This Home
This home is located at 4314 N Pershing Dr Unit 43141, Arlington, VA 22203 and is currently estimated at $335,800, approximately $375 per square foot. 4314 N Pershing Dr Unit 43141 is a home located in Arlington County with nearby schools including Barrett Elementary School, Swanson Middle School, and Washington Liberty High School.
Ownership History
Date
Name
Owned For
Owner Type
Purchase Details
Closed on
Aug 31, 2012
Sold by
Liles Laurita C
Bought by
Roderick Moore Vincent
Current Estimated Value
Home Financials for this Owner
Home Financials are based on the most recent Mortgage that was taken out on this home.
Original Mortgage
$234,945
Outstanding Balance
$162,496
Interest Rate
3.56%
Mortgage Type
VA
Estimated Equity
$173,304
Purchase Details
Closed on
May 29, 1998
Sold by
Meisner Baly Glenn W and Meisner Baly Lora W
Bought by
Liles Laurita C
Home Financials for this Owner
Home Financials are based on the most recent Mortgage that was taken out on this home.
Original Mortgage
$55,100
Interest Rate
7.12%
Mortgage Type
New Conventional
Purchase Details
Closed on
May 24, 1995
Sold by
Arlington Oaks Community Assn
Bought by
Baly Glenn W
Create a Home Valuation Report for This Property
The Home Valuation Report is an in-depth analysis detailing your home's value as well as a comparison with similar homes in the area
Home Values in the Area
Average Home Value in this Area
Purchase History
| Date | Buyer | Sale Price | Title Company |
|---|---|---|---|
| Roderick Moore Vincent | $230,000 | -- | |
| Liles Laurita C | $58,000 | -- | |
| Baly Glenn W | $64,100 | -- |
Source: Public Records
Mortgage History
| Date | Status | Borrower | Loan Amount |
|---|---|---|---|
| Open | Roderick Moore Vincent | $234,945 | |
| Previous Owner | Baly Glenn W | $55,100 |
Source: Public Records
Tax History Compared to Growth
Tax History
| Year | Tax Paid | Tax Assessment Tax Assessment Total Assessment is a certain percentage of the fair market value that is determined by local assessors to be the total taxable value of land and additions on the property. | Land | Improvement |
|---|---|---|---|---|
| 2025 | $3,136 | $303,600 | $68,800 | $234,800 |
| 2024 | $3,043 | $294,600 | $68,800 | $225,800 |
| 2023 | $3,157 | $306,500 | $68,800 | $237,700 |
| 2022 | $2,819 | $273,700 | $68,800 | $204,900 |
| 2021 | $2,819 | $273,700 | $68,800 | $204,900 |
| 2020 | $2,550 | $248,500 | $50,100 | $198,400 |
| 2019 | $2,472 | $240,900 | $50,100 | $190,800 |
| 2018 | $2,404 | $239,000 | $50,100 | $188,900 |
| 2017 | $2,358 | $234,400 | $50,100 | $184,300 |
| 2016 | $2,323 | $234,400 | $50,100 | $184,300 |
| 2015 | $2,431 | $244,100 | $50,100 | $194,000 |
| 2014 | $2,340 | $234,900 | $50,100 | $184,800 |
Source: Public Records
Map
Nearby Homes
- 4307 2nd Rd N Unit 43074
- 4324 2nd Rd N Unit 43241
- 110 N George Mason Dr Unit 1103
- 4378 N Pershing Dr Unit 43781
- 4374 N Pershing Dr Unit 1
- 4501 Arlington Blvd Unit 126
- 4501 Arlington Blvd Unit 807
- 3851 2nd St N
- 4141 N Henderson Rd Unit 107
- 4141 N Henderson Rd Unit 809
- 4141 N Henderson Rd Unit 702
- 4141 N Henderson Rd Unit 303
- 504 B N Thomas St
- 102 S Glebe Rd
- 11 S Abingdon St
- 4810 3rd St N
- 143 N Abingdon St
- 30 S Old Glebe Rd Unit 106E
- 24 S Abingdon St
- 4223 N Carlin Springs Rd
- 4314 N Pershing Dr Unit 2
- 4314 N Pershing Dr Unit 1
- 4314 N Pershing Dr Unit 43144
- 4314 N Pershing Dr Unit 43143
- 4314 N Pershing Dr Unit 43142
- 4316 N Pershing Dr Unit 43162
- 4316 N Pershing Dr Unit 43163
- 4316 N Pershing Dr Unit 43164
- 4316 N Pershing Dr Unit 43161
- 4316 N Pershing Dr Unit 2
- 4316 N Pershing Dr Unit 2
- 4318 N Pershing Dr Unit 43183
- 240 N Thomas St Unit 248-1
- 4318 N Pershing Dr Unit 43181
- 4318 N Pershing Dr Unit 43184
- 4318 N Pershing Dr Unit 43182
- 4318 N Pershing Dr Unit 1
- 4312 N Pershing Dr Unit 4
- 4312 N Pershing Dr Unit 43124
- 4312 N Pershing Dr Unit 43123