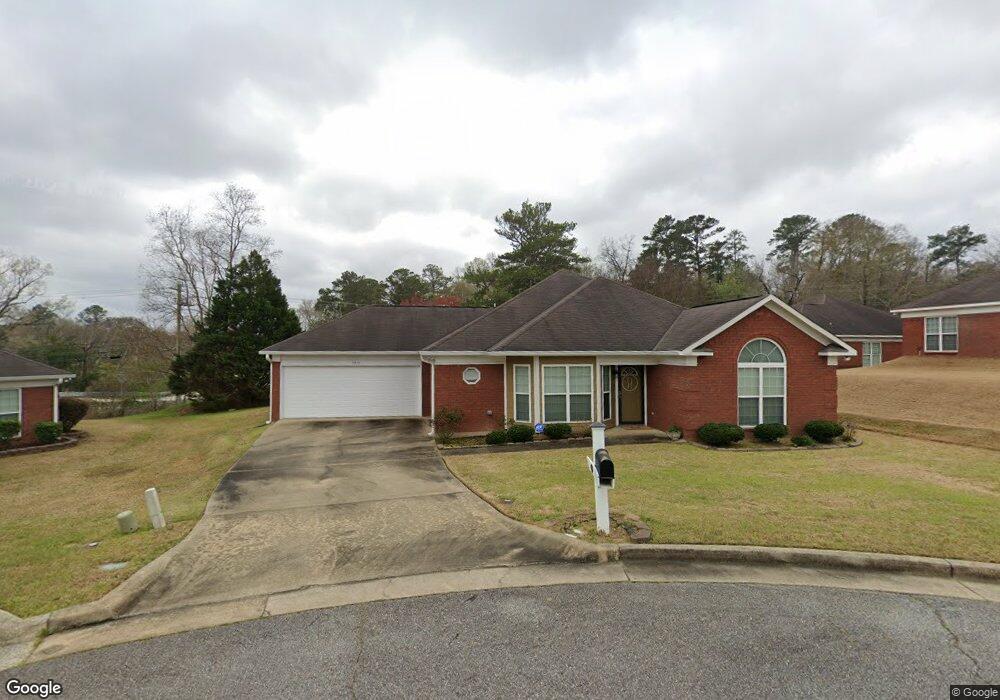
4314 Tumblestone Ct Columbus, GA 31907
Estimated Value: $210,000 - $238,000
3
Beds
3
Baths
1,469
Sq Ft
$153/Sq Ft
Est. Value
About This Home
This home is located at 4314 Tumblestone Ct, Columbus, GA 31907 and is currently estimated at $225,340, approximately $153 per square foot. 4314 Tumblestone Ct is a home located in Muscogee County with nearby schools including Gentian Elementary School, Fort Middle School, and Hardaway High School.
Ownership History
Date
Name
Owned For
Owner Type
Purchase Details
Closed on
Jun 25, 2012
Sold by
Federal National Mortgage Association
Bought by
Armour Jeffery and Armour Gloria
Current Estimated Value
Home Financials for this Owner
Home Financials are based on the most recent Mortgage that was taken out on this home.
Original Mortgage
$137,464
Outstanding Balance
$94,122
Interest Rate
3.5%
Mortgage Type
FHA
Estimated Equity
$131,218
Purchase Details
Closed on
Apr 3, 2012
Sold by
Harris Rhonda Camille
Bought by
Federal National Mtg Associati
Purchase Details
Closed on
Jul 6, 2007
Sold by
Donald Bowles Inc
Bought by
Harris Rhonda Camille and Harris Robyn L E
Home Financials for this Owner
Home Financials are based on the most recent Mortgage that was taken out on this home.
Original Mortgage
$171,900
Interest Rate
6.37%
Mortgage Type
Purchase Money Mortgage
Create a Home Valuation Report for This Property
The Home Valuation Report is an in-depth analysis detailing your home's value as well as a comparison with similar homes in the area
Home Values in the Area
Average Home Value in this Area
Purchase History
| Date | Buyer | Sale Price | Title Company |
|---|---|---|---|
| Armour Jeffery | -- | -- | |
| Federal National Mtg Associati | $112,636 | -- | |
| Harris Rhonda Camille | $171,900 | None Available | |
| Donald Bowles Inc | $15,000 | None Available |
Source: Public Records
Mortgage History
| Date | Status | Borrower | Loan Amount |
|---|---|---|---|
| Open | Armour Jeffery | $137,464 | |
| Closed | Armour Jeffery | $7,500 | |
| Previous Owner | Harris Rhonda Camille | $171,900 |
Source: Public Records
Tax History Compared to Growth
Tax History
| Year | Tax Paid | Tax Assessment Tax Assessment Total Assessment is a certain percentage of the fair market value that is determined by local assessors to be the total taxable value of land and additions on the property. | Land | Improvement |
|---|---|---|---|---|
| 2025 | $1,676 | $80,792 | $8,656 | $72,136 |
| 2024 | $1,675 | $80,792 | $8,656 | $72,136 |
| 2023 | $991 | $80,792 | $8,656 | $72,136 |
| 2022 | $1,747 | $66,668 | $8,656 | $58,012 |
| 2021 | $1,740 | $59,184 | $8,656 | $50,528 |
| 2020 | $1,740 | $59,184 | $8,656 | $50,528 |
| 2019 | $1,748 | $59,184 | $8,656 | $50,528 |
| 2018 | $1,748 | $59,184 | $8,656 | $50,528 |
| 2017 | $1,755 | $59,184 | $8,656 | $50,528 |
| 2016 | $1,763 | $56,000 | $14,000 | $42,000 |
| 2015 | $1,765 | $56,000 | $14,000 | $42,000 |
| 2014 | $1,768 | $56,000 | $14,000 | $42,000 |
| 2013 | -- | $56,000 | $14,000 | $42,000 |
Source: Public Records
Map
Nearby Homes
- 4017 River Rock Way
- 4520 Marci Ct
- 4133 Pickering Dr
- 4110 Norwood Dr
- 4807 Fairview Dr
- 4047 Sealy Ln
- 4709 Rowland Ave
- 10 Conisburgh Ct
- 4813 Rowland Ct
- 4004 Tifton Dr
- 3935 Tifton Dr
- 4524 Hedingham Ln
- 4419 Anglin Rd
- 3872 E Britt David Rd
- 4120 Fairview Dr
- 5216 Moon Rd
- 3816 Anglin Rd
- 2 Hidden Woods Ct
- 3504 Vernon Dr
- 4635 Delfair Dr
- 4310 Tumblestone Ct
- 4316 Tumblestone Ct
- 4201 Reese Rd
- 4000 River Rock Way
- 0 Tumblestone Ct Unit 7191192
- 0 Tumblestone Ct Unit 7075025
- 4313 Tumblestone Ct
- 4318 Tumblestone Ct
- 4016 River Rock Way
- 4317 Tumblestone Ct
- 4315 Tumblestone Ct
- 4208 Reese Rd
- 4214 Reese Rd
- 4202 Reese Rd
- 4020 River Rock Way
- 4009 River Rock Way
- 4001 River Rock Way
- 5510 River Rock Ct
- 4013 River Rock Way
- 4146 Reese Rd