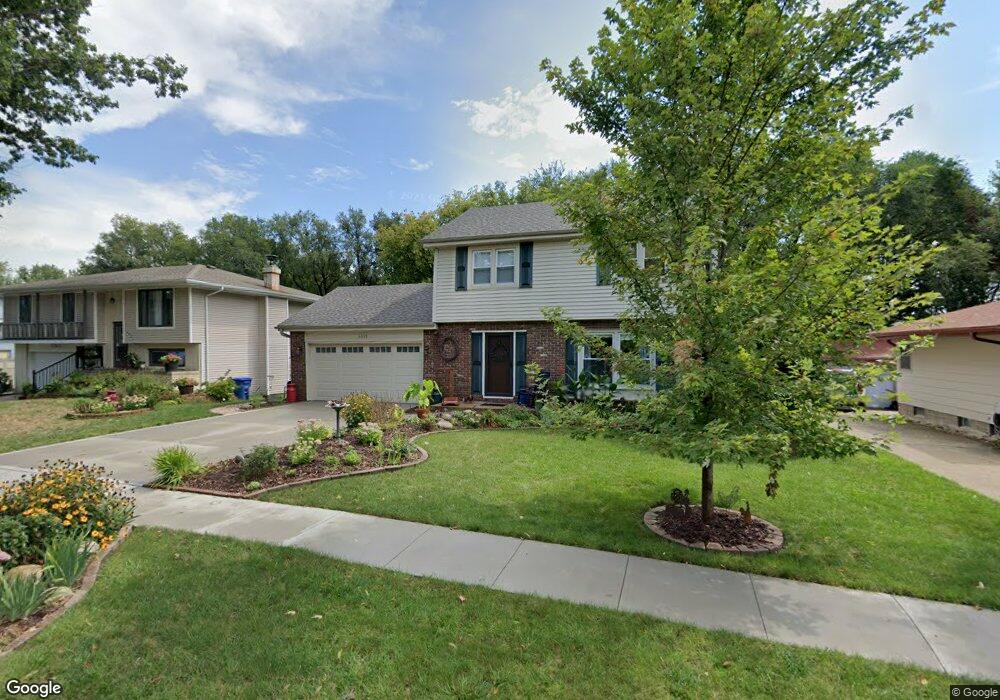
4315 51st St Des Moines, IA 50310
Meredith NeighborhoodEstimated Value: $279,000 - $304,000
4
Beds
2
Baths
1,400
Sq Ft
$207/Sq Ft
Est. Value
About This Home
This home is located at 4315 51st St, Des Moines, IA 50310 and is currently estimated at $290,243, approximately $207 per square foot. 4315 51st St is a home located in Polk County with nearby schools including Lawson Elementary School, Johnston Middle School, and Summit Middle School.
Ownership History
Date
Name
Owned For
Owner Type
Purchase Details
Closed on
Oct 3, 2013
Sold by
Starnes Paul P and Haupt Terri L
Bought by
Josten James
Current Estimated Value
Purchase Details
Closed on
Mar 11, 1998
Sold by
Peterson Kenneth M and Peterson Kristine A
Bought by
Josten James E and Josten Carol M
Home Financials for this Owner
Home Financials are based on the most recent Mortgage that was taken out on this home.
Original Mortgage
$90,800
Interest Rate
7.23%
Create a Home Valuation Report for This Property
The Home Valuation Report is an in-depth analysis detailing your home's value as well as a comparison with similar homes in the area
Home Values in the Area
Average Home Value in this Area
Purchase History
| Date | Buyer | Sale Price | Title Company |
|---|---|---|---|
| Josten James | $99,000 | None Available | |
| Josten James E | $113,000 | -- |
Source: Public Records
Mortgage History
| Date | Status | Borrower | Loan Amount |
|---|---|---|---|
| Previous Owner | Josten James E | $90,800 |
Source: Public Records
Tax History Compared to Growth
Tax History
| Year | Tax Paid | Tax Assessment Tax Assessment Total Assessment is a certain percentage of the fair market value that is determined by local assessors to be the total taxable value of land and additions on the property. | Land | Improvement |
|---|---|---|---|---|
| 2025 | $4,486 | $285,000 | $54,400 | $230,600 |
| 2024 | $4,486 | $249,800 | $47,200 | $202,600 |
| 2023 | $4,666 | $249,800 | $47,200 | $202,600 |
| 2022 | $5,142 | $217,200 | $42,000 | $175,200 |
| 2021 | $5,050 | $217,200 | $42,000 | $175,200 |
| 2020 | $4,956 | $203,500 | $39,300 | $164,200 |
| 2019 | $4,622 | $203,500 | $39,300 | $164,200 |
| 2018 | $4,570 | $181,400 | $34,400 | $147,000 |
| 2017 | $4,268 | $181,400 | $34,400 | $147,000 |
| 2016 | $4,160 | $167,100 | $31,300 | $135,800 |
| 2015 | $4,160 | $167,100 | $31,300 | $135,800 |
| 2014 | $4,072 | $162,200 | $30,500 | $131,700 |
Source: Public Records
Map
Nearby Homes