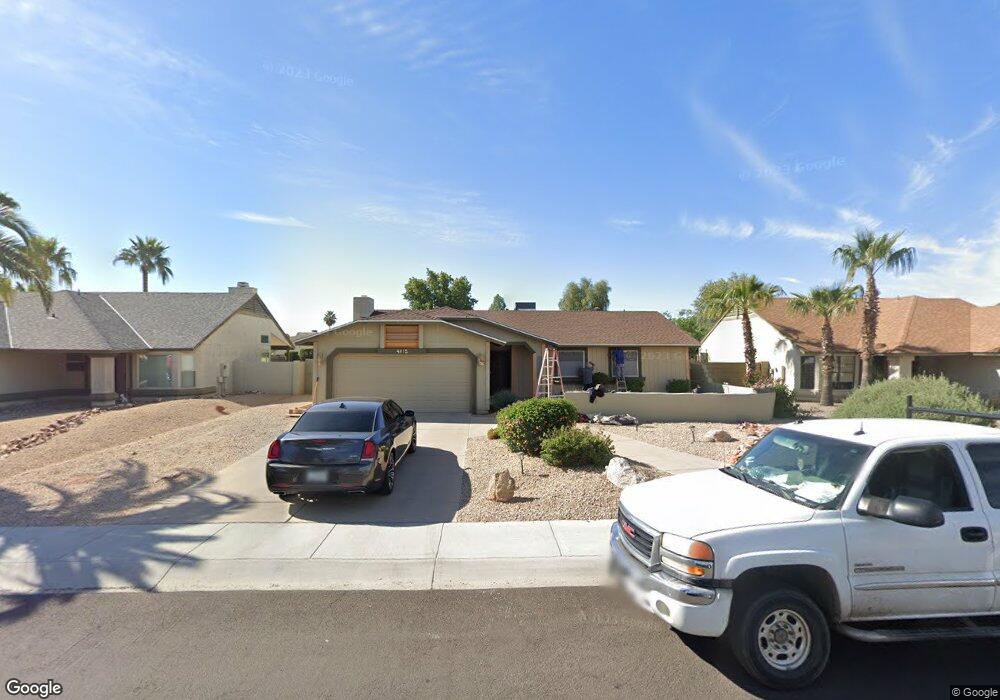
4315 E Nisbet Rd Unit 10 Phoenix, AZ 85032
Paradise Valley Village NeighborhoodEstimated Value: $437,844 - $587,000
4
Beds
2
Baths
1,512
Sq Ft
$351/Sq Ft
Est. Value
About This Home
This home is located at 4315 E Nisbet Rd Unit 10, Phoenix, AZ 85032 and is currently estimated at $530,211, approximately $350 per square foot. 4315 E Nisbet Rd Unit 10 is a home located in Maricopa County with nearby schools including Whispering Wind Academy, Sunrise Middle School, and Paradise Valley High School.
Ownership History
Date
Name
Owned For
Owner Type
Purchase Details
Closed on
Aug 5, 2024
Sold by
Citrin Julie Ann
Bought by
Julie A Citrin Living Trust and Citrin
Current Estimated Value
Purchase Details
Closed on
Apr 5, 2011
Sold by
Wells Fargo Bank Na
Bought by
Citrin Julie Ann
Purchase Details
Closed on
Jan 10, 2011
Sold by
Grindle Austinay K
Bought by
Wells Fargo Bank Na
Purchase Details
Closed on
Mar 16, 2006
Sold by
Grindle Austinay K and Guido Austinay K
Bought by
Grindle Austinay K
Home Financials for this Owner
Home Financials are based on the most recent Mortgage that was taken out on this home.
Original Mortgage
$100,000
Interest Rate
6.19%
Mortgage Type
Credit Line Revolving
Purchase Details
Closed on
Apr 5, 1994
Sold by
Hammer Paul B and Hammer Sylvia C
Bought by
Guido Austinay K
Create a Home Valuation Report for This Property
The Home Valuation Report is an in-depth analysis detailing your home's value as well as a comparison with similar homes in the area
Home Values in the Area
Average Home Value in this Area
Purchase History
| Date | Buyer | Sale Price | Title Company |
|---|---|---|---|
| Julie A Citrin Living Trust | -- | None Listed On Document | |
| Citrin Julie Ann | $114,900 | Fidelity Natl Title Ins Co | |
| Wells Fargo Bank Na | $109,383 | Accommodation | |
| Grindle Austinay K | -- | Custom Title Solutions | |
| Guido Austinay K | $112,000 | First American Title |
Source: Public Records
Mortgage History
| Date | Status | Borrower | Loan Amount |
|---|---|---|---|
| Previous Owner | Grindle Austinay K | $100,000 |
Source: Public Records
Tax History Compared to Growth
Tax History
| Year | Tax Paid | Tax Assessment Tax Assessment Total Assessment is a certain percentage of the fair market value that is determined by local assessors to be the total taxable value of land and additions on the property. | Land | Improvement |
|---|---|---|---|---|
| 2025 | $1,475 | $16,646 | -- | -- |
| 2024 | $1,513 | $16,646 | -- | -- |
| 2023 | $1,513 | $23,600 | $4,720 | $18,880 |
| 2022 | $1,574 | $23,600 | $4,720 | $18,880 |
| 2021 | $1,680 | $25,450 | $5,090 | $20,360 |
| 2020 | $1,703 | $23,600 | $4,720 | $18,880 |
| 2019 | $1,711 | $22,320 | $4,460 | $17,860 |
| 2018 | $1,649 | $20,230 | $4,040 | $16,190 |
| 2017 | $1,575 | $19,410 | $3,880 | $15,530 |
| 2016 | $1,550 | $18,260 | $3,650 | $14,610 |
| 2015 | $1,545 | $16,510 | $3,300 | $13,210 |
Source: Public Records
Map
Nearby Homes
- 4340 E Nisbet Rd
- 4441 E Sunnyside Ln
- 4330 E Beck Ln
- 4409 E Gelding Dr
- 15402 N 45th Place
- 4335 E Betty Elyse Ln
- 4434 E Beck Ln
- 4301 E Betty Elyse Ln
- 4060 E Karen Dr
- 15020 N 40th St Unit 41
- 15008 N 48th Place
- 15014 N 48th Place
- 4727 E Betty Elyse Ln
- 3908 E Marilyn Rd
- 4815 E Everett Dr
- 4363 E Friess Dr
- 14219 N 39th Way
- 3845 E Greenway Rd Unit 230
- 4316 E Ludlow Dr
- 4839 E Marilyn Rd
- 4319 E Nisbet Rd
- 4309 E Nisbet Rd
- 4323 E Nisbet Rd
- 4325 E Nisbet Rd
- 4301 E Nisbet Rd
- 4316 E Vista Dr
- 4310 E Vista Dr
- 4320 E Vista Dr
- 4324 E Nisbet Rd
- 4328 E Nisbet Rd
- 4320 E Nisbet Rd
- 4331 E Nisbet Rd
- 4302 E Vista Dr
- 4326 E Vista Dr
- 4332 E Nisbet Rd
- 4316 E Nisbet Rd
- 4335 E Nisbet Rd
- 4263 E Nisbet Rd
- 4336 E Nisbet Rd
- 4338 E Vista Dr