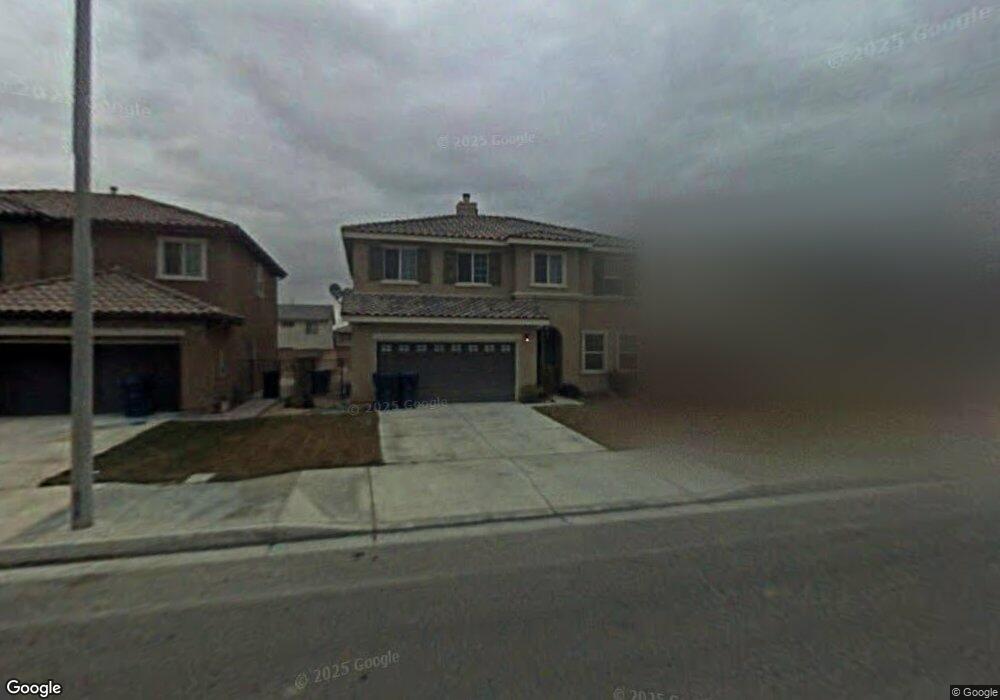
4315 Jonathon St Lancaster, CA 93536
West Lancaster NeighborhoodEstimated Value: $497,385 - $576,000
3
Beds
3
Baths
2,045
Sq Ft
$261/Sq Ft
Est. Value
About This Home
This home is located at 4315 Jonathon St, Lancaster, CA 93536 and is currently estimated at $533,596, approximately $260 per square foot. 4315 Jonathon St is a home located in Los Angeles County with nearby schools including West Wind Elementary School, Endeavour Middle School, and Lancaster High School.
Ownership History
Date
Name
Owned For
Owner Type
Purchase Details
Closed on
Jun 28, 2018
Sold by
2018 3 Ih Borrower Lp
Bought by
2018 3 Ih Borrower Lp
Current Estimated Value
Purchase Details
Closed on
Jun 19, 2015
Sold by
Ih2 Property West Lp
Bought by
2015-3 Ih2 Borrower Lp
Home Financials for this Owner
Home Financials are based on the most recent Mortgage that was taken out on this home.
Original Mortgage
$119,395,000
Interest Rate
3.83%
Mortgage Type
Loan Amount Between One & Nine Billion
Purchase Details
Closed on
Jun 21, 2013
Sold by
Huerta Gilbert Gonzalez
Bought by
Ih2 Property West Lp
Purchase Details
Closed on
Sep 22, 2004
Sold by
Western Pacific Housing Inc
Bought by
Huerta Gilbert Gonzalez
Home Financials for this Owner
Home Financials are based on the most recent Mortgage that was taken out on this home.
Original Mortgage
$257,305
Interest Rate
6.25%
Mortgage Type
Purchase Money Mortgage
Create a Home Valuation Report for This Property
The Home Valuation Report is an in-depth analysis detailing your home's value as well as a comparison with similar homes in the area
Home Values in the Area
Average Home Value in this Area
Purchase History
| Date | Buyer | Sale Price | Title Company |
|---|---|---|---|
| 2018 3 Ih Borrower Lp | -- | Os National Llc | |
| 2015-3 Ih2 Borrower Lp | -- | Fidelity Natl Title Group | |
| Ih2 Property West Lp | $199,000 | Fidelity National Title Co | |
| Huerta Gilbert Gonzalez | $322,000 | First American Title Co |
Source: Public Records
Mortgage History
| Date | Status | Borrower | Loan Amount |
|---|---|---|---|
| Previous Owner | 2015-3 Ih2 Borrower Lp | $119,395,000 | |
| Previous Owner | Huerta Gilbert Gonzalez | $257,305 | |
| Closed | Huerta Gilbert Gonzalez | $64,326 |
Source: Public Records
Tax History
| Year | Tax Paid | Tax Assessment Tax Assessment Total Assessment is a certain percentage of the fair market value that is determined by local assessors to be the total taxable value of land and additions on the property. | Land | Improvement |
|---|---|---|---|---|
| 2025 | $5,642 | $343,988 | $85,995 | $257,993 |
| 2024 | $5,642 | $337,244 | $84,309 | $252,935 |
| 2023 | $5,523 | $330,632 | $82,656 | $247,976 |
| 2022 | $5,288 | $324,150 | $81,036 | $243,114 |
| 2021 | $4,867 | $317,796 | $79,448 | $238,348 |
| 2020 | $4,811 | $314,539 | $78,634 | $235,905 |
| 2019 | $3,258 | $186,041 | $49,448 | $136,593 |
| 2018 | $3,202 | $182,394 | $48,479 | $133,915 |
| 2016 | $3,033 | $175,314 | $46,598 | $128,716 |
| 2015 | $2,996 | $172,682 | $45,899 | $126,783 |
| 2014 | -- | $169,300 | $45,000 | $124,300 |
Source: Public Records
Map
Nearby Homes
- 4244 Jonathon St
- 4225 Vahan Ct
- 43929 44th St W
- 43890 Moccasin Place
- 43834 Firewood Way
- 44128 Westridge Dr
- 44302 Marbella St
- 4019 W Avenue j9
- 0 47th St W
- 44235 Westridge Dr
- 44047 Colony Ct
- 43936 Catsue Place
- 44130 Catsue Place
- 4727 Vahan Ct
- 4536 Jade Ct
- 3812 Jonathon Ct
- 44340 46th St W
- 43705 46th St W
- 44108 Countryside Dr
- 44328 47th St W
- 4309 Jonathon St
- 4319 Jonathon St
- 4316 W Avenue j7
- 4301 Jonathon St
- 4325 Jonathon St
- 4322 W Avenue j7
- 4308 W Avenue j7
- 4326 W Avenue j7
- 4300 W Avenue j7
- 4249 Jonathon St
- 4403 Jonathon St
- 4316 Jonathon St
- 4308 Jonathon St
- 4320 Jonathon St
- 4302 Jonathon St
- 4248 W Avenue j7
- 4326 Jonathon St
- 4243 Jonathon St
- 4411 Jonathon St
- 4250 Jonathon St
Your Personal Tour Guide
Ask me questions while you tour the home.