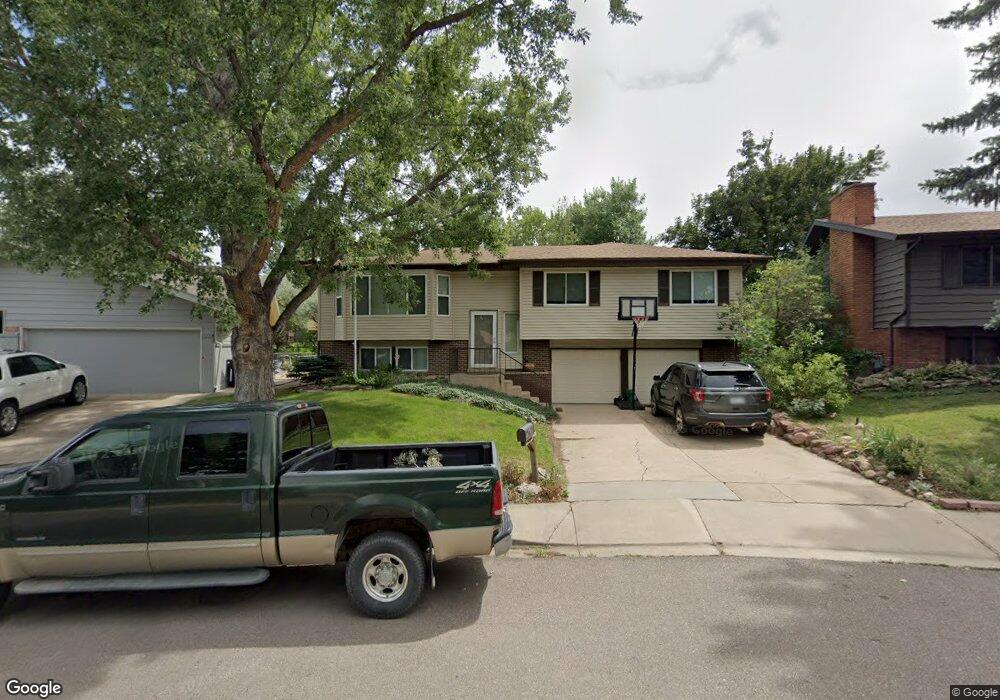
4316 Butler Cir Boulder, CO 80305
Table Mesa NeighborhoodEstimated Value: $1,107,000 - $1,367,000
4
Beds
2
Baths
1,776
Sq Ft
$698/Sq Ft
Est. Value
About This Home
This home is located at 4316 Butler Cir, Boulder, CO 80305 and is currently estimated at $1,240,378, approximately $698 per square foot. 4316 Butler Cir is a home located in Boulder County with nearby schools including Mesa Elementary School, Bear Creek Elementary School, and Southern Hills Middle School.
Ownership History
Date
Name
Owned For
Owner Type
Purchase Details
Closed on
Nov 17, 2004
Sold by
Ganousis Louis G
Bought by
Cash Deborah G Dodge and Cash Donald Edward
Current Estimated Value
Home Financials for this Owner
Home Financials are based on the most recent Mortgage that was taken out on this home.
Original Mortgage
$333,700
Outstanding Balance
$167,525
Interest Rate
5.87%
Mortgage Type
Purchase Money Mortgage
Estimated Equity
$1,072,853
Purchase Details
Closed on
Dec 29, 1995
Sold by
Mckinney Ruth E and Ganousis Louis G
Bought by
Ganousis Louis G
Purchase Details
Closed on
Jul 25, 1990
Bought by
Cash Deborah G Dodge and Cash Donald Edward
Purchase Details
Closed on
Oct 8, 1985
Bought by
Cash Deborah G Dodge and Cash Donald Edward
Create a Home Valuation Report for This Property
The Home Valuation Report is an in-depth analysis detailing your home's value as well as a comparison with similar homes in the area
Home Values in the Area
Average Home Value in this Area
Purchase History
| Date | Buyer | Sale Price | Title Company |
|---|---|---|---|
| Cash Deborah G Dodge | $437,400 | -- | |
| Ganousis Louis G | -- | -- | |
| Ganousis Louis G | -- | -- | |
| Cash Deborah G Dodge | $116,000 | -- | |
| Cash Deborah G Dodge | $106,000 | -- |
Source: Public Records
Mortgage History
| Date | Status | Borrower | Loan Amount |
|---|---|---|---|
| Open | Cash Deborah G Dodge | $333,700 |
Source: Public Records
Tax History
| Year | Tax Paid | Tax Assessment Tax Assessment Total Assessment is a certain percentage of the fair market value that is determined by local assessors to be the total taxable value of land and additions on the property. | Land | Improvement |
|---|---|---|---|---|
| 2025 | $7,038 | $74,725 | $57,775 | $16,950 |
| 2024 | $7,038 | $74,725 | $57,775 | $16,950 |
| 2023 | $6,916 | $80,085 | $66,303 | $17,467 |
| 2022 | $5,925 | $63,808 | $48,775 | $15,033 |
| 2021 | $5,650 | $65,644 | $50,179 | $15,465 |
| 2020 | $5,035 | $57,844 | $46,189 | $11,655 |
| 2019 | $4,958 | $57,844 | $46,189 | $11,655 |
| 2018 | $4,752 | $54,806 | $32,544 | $22,262 |
| 2017 | $4,603 | $60,591 | $35,979 | $24,612 |
| 2016 | $4,096 | $47,322 | $26,268 | $21,054 |
| 2015 | $3,879 | $41,544 | $18,786 | $22,758 |
| 2014 | $3,493 | $41,544 | $18,786 | $22,758 |
Source: Public Records
Map
Nearby Homes
- 4445 Grinnell Ave
- 4380 Ludlow St
- 4445 Squires Cir
- 4630 MacKy Way
- 725 S 45th St
- 1516 Chambers Dr
- 3490 Emerson Ave
- 3450 Emerson Ave
- 4286 Greenbriar Blvd
- 4204 Greenbriar Blvd Unit 45
- 800 W Moorhead Cir Unit E
- 860 W Moorhead Cir Unit 2K
- 860 W Moorhead Cir Unit 1I
- 860 W Moorhead Cir Unit 2H
- 750 W Moorhead Cir Unit A
- 3210 Emerson Ave
- 4763 Tantra Dr Unit B
- 1596 Bradley Dr Unit 105C
- 450 S 41st St
- 3970 Longwood Ave
- 4310 Butler Cir
- 4320 Butler Cir
- 4376 Butler Cir
- 4370 Butler Cir
- 4330 Butler Cir
- 4386 Butler Cir
- 4360 Butler Cir
- 1105 Toedtli Dr
- 1125 Toedtli Dr
- 4340 Butler Cir
- 4309 Butler Cir
- 4305 Butler Cir
- 4313 Butler Cir
- 4390 Butler Cir
- 715 Toedtli Dr
- 4317 Butler Cir
- 4375 Butler Cir
- 4381 Butler Cir
- 1085 Toedtli Dr
- 4371 Butler Cir
Your Personal Tour Guide
Ask me questions while you tour the home.