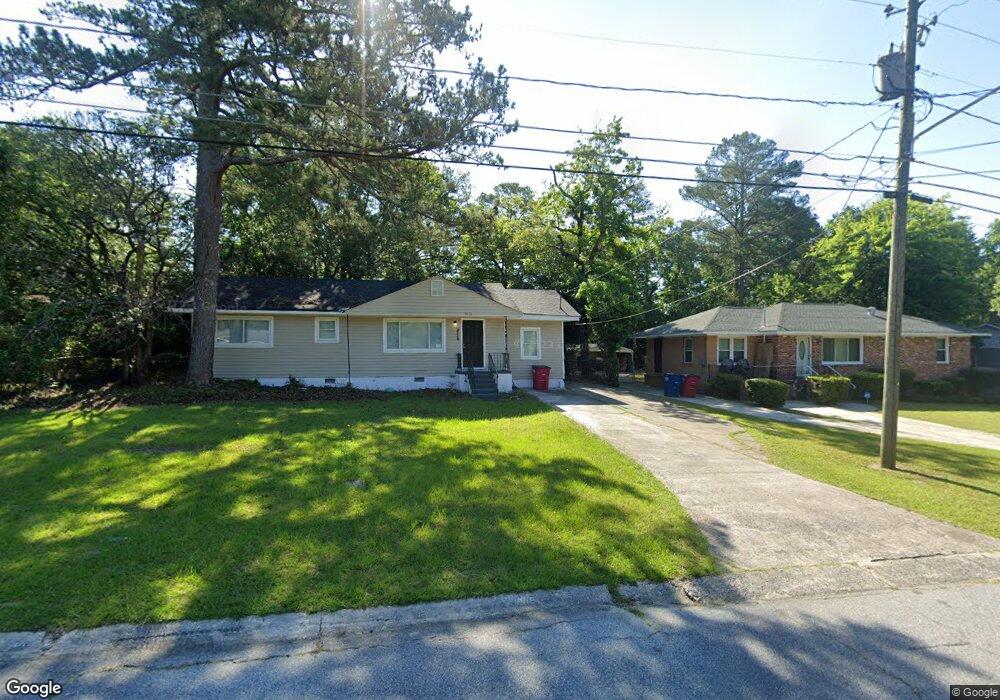
4316 Summerhill Dr Macon, GA 31204
Estimated Value: $123,630 - $146,000
3
Beds
2
Baths
1,592
Sq Ft
$85/Sq Ft
Est. Value
About This Home
This home is located at 4316 Summerhill Dr, Macon, GA 31204 and is currently estimated at $135,908, approximately $85 per square foot. 4316 Summerhill Dr is a home located in Bibb County with nearby schools including Veterans Elementary School, Weaver Middle School, and Westside High School.
Ownership History
Date
Name
Owned For
Owner Type
Purchase Details
Closed on
Jun 2, 2022
Sold by
Jeffery Neisler
Bought by
Sfr3-040 Llc
Current Estimated Value
Purchase Details
Closed on
Oct 6, 2009
Sold by
Mitchell Lori A
Bought by
Neisler Jeff
Purchase Details
Closed on
Jan 22, 2007
Sold by
Mitchell Lori A
Bought by
City Of Macons Economic & Community Deve
Home Financials for this Owner
Home Financials are based on the most recent Mortgage that was taken out on this home.
Original Mortgage
$72,450
Interest Rate
6.08%
Mortgage Type
Unknown
Purchase Details
Closed on
Jan 19, 2007
Sold by
Mongomery Annette T and Johnson Marsha Montgomery
Bought by
Mitchell Lori A
Home Financials for this Owner
Home Financials are based on the most recent Mortgage that was taken out on this home.
Original Mortgage
$72,450
Interest Rate
6.08%
Mortgage Type
Unknown
Create a Home Valuation Report for This Property
The Home Valuation Report is an in-depth analysis detailing your home's value as well as a comparison with similar homes in the area
Home Values in the Area
Average Home Value in this Area
Purchase History
| Date | Buyer | Sale Price | Title Company |
|---|---|---|---|
| Sfr3-040 Llc | $76,000 | None Listed On Document | |
| Sfr3-040 Llc | $76,000 | None Listed On Document | |
| Neisler Jeff | $21,300 | -- | |
| Neisler Jeff | $21,251 | None Available | |
| City Of Macons Economic & Community Deve | $19,500 | None Available | |
| Mitchell Lori A | $80,500 | None Available |
Source: Public Records
Mortgage History
| Date | Status | Borrower | Loan Amount |
|---|---|---|---|
| Previous Owner | Mitchell Lori A | $72,450 |
Source: Public Records
Tax History Compared to Growth
Tax History
| Year | Tax Paid | Tax Assessment Tax Assessment Total Assessment is a certain percentage of the fair market value that is determined by local assessors to be the total taxable value of land and additions on the property. | Land | Improvement |
|---|---|---|---|---|
| 2025 | $1,064 | $43,290 | $4,800 | $38,490 |
| 2024 | $1,099 | $43,290 | $4,800 | $38,490 |
| 2023 | $772 | $34,802 | $4,000 | $30,802 |
| 2022 | $812 | $23,450 | $3,948 | $19,502 |
| 2021 | $650 | $17,110 | $1,500 | $15,610 |
| 2020 | $589 | $15,168 | $1,342 | $13,826 |
| 2019 | $595 | $15,168 | $1,342 | $13,826 |
| 2018 | $898 | $11,978 | $1,342 | $10,636 |
| 2017 | $449 | $11,978 | $1,342 | $10,636 |
| 2016 | $414 | $11,979 | $1,342 | $10,636 |
| 2015 | $614 | $12,528 | $1,579 | $10,949 |
| 2014 | $720 | $12,776 | $4,106 | $8,670 |
Source: Public Records
Map
Nearby Homes
- 4376 Log Cabin
- 3896 Log Cabin Dr
- 4158 Log Cabin Dr
- 4453 Pharr Ave
- 4506 Ebenezer Church Rd
- 4032 Winding Way Ct
- 4015 Dellwood Dr
- 4501 Massey Rd
- 4722 Bishop Rd
- 4559 Massey Rd
- 3745 Partridge Dr
- 4112 W Hickory Ct
- 4712 Brookhaven Rd
- 3850 Gadson Dr
- 4527 Wilson Rd
- 3941 Log Cabin Dr
- 4090 W Oak Dr
- 3908 Log Cabin Dr
- 3771 Walker Ave
- 3846 Log Cabin Dr
- 4322 Summerhill Dr
- 4310 Summerhill Dr
- 4328 Summerhill Dr
- 4304 Summerhill Dr
- 4319 Summerhill Dr
- 4313 Summerhill Dr
- 4334 Summerhill Dr
- 4325 Summerhill Dr
- 4307 Summerhill Dr
- 4331 Summerhill Dr
- 4340 Summerhill Dr
- 4337 Summerhill Dr
- 4346 Summerhill Dr
- 4346 Summerhill Dr Unit 112
- 4006 Mercer University Dr
- 4352 Summerhill Dr
- 4349 Summerhill Dr
- 4197 Briarwood Dr
- 4195 Briarwood Dr
- 4355 Summerhill Dr