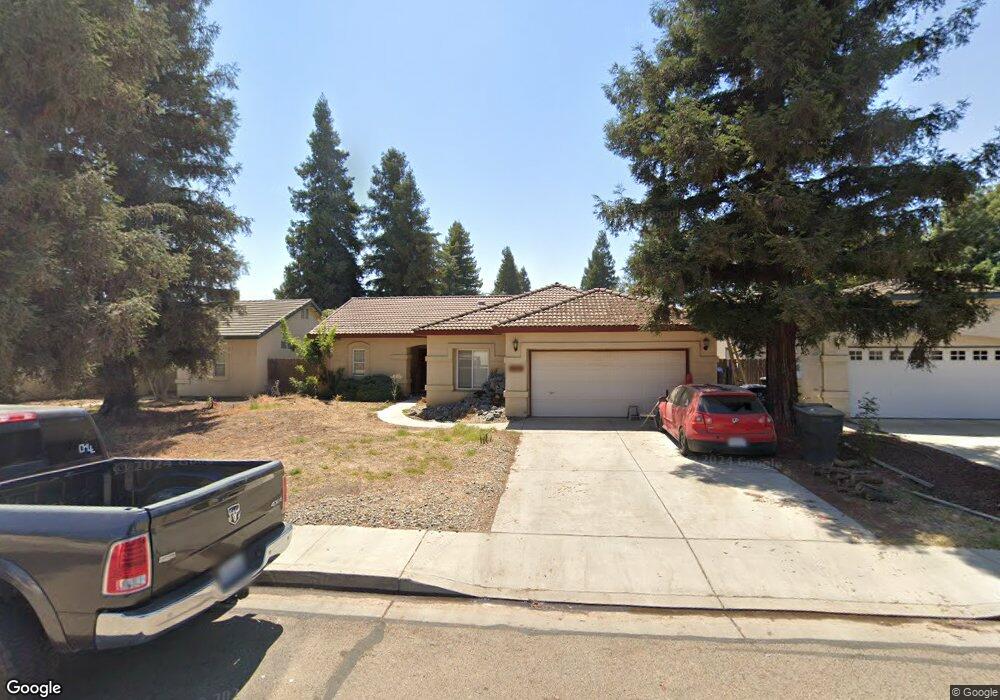
4317 E Meadow Ave Visalia, CA 93292
Estimated Value: $350,035 - $383,000
3
Beds
2
Baths
1,447
Sq Ft
$252/Sq Ft
Est. Value
About This Home
This home is located at 4317 E Meadow Ave, Visalia, CA 93292 and is currently estimated at $364,509, approximately $251 per square foot. 4317 E Meadow Ave is a home located in Tulare County with nearby schools including Mineral King Elementary School, Valley Oak Middle School, and Golden West High School.
Ownership History
Date
Name
Owned For
Owner Type
Purchase Details
Closed on
Apr 9, 2009
Sold by
Deutsche Bank National Trust Company
Bought by
Solis Olga and Solis Aristeo
Current Estimated Value
Home Financials for this Owner
Home Financials are based on the most recent Mortgage that was taken out on this home.
Original Mortgage
$112,500
Interest Rate
4.78%
Mortgage Type
Purchase Money Mortgage
Purchase Details
Closed on
Mar 6, 2009
Sold by
Contreras Jose
Bought by
Deutsche Bank National Trust Company
Home Financials for this Owner
Home Financials are based on the most recent Mortgage that was taken out on this home.
Original Mortgage
$112,500
Interest Rate
4.78%
Mortgage Type
Purchase Money Mortgage
Purchase Details
Closed on
May 31, 2005
Sold by
Hall Naomi R
Bought by
Contreras Jose and Contreras Amelia
Home Financials for this Owner
Home Financials are based on the most recent Mortgage that was taken out on this home.
Original Mortgage
$234,400
Interest Rate
6.2%
Mortgage Type
Purchase Money Mortgage
Create a Home Valuation Report for This Property
The Home Valuation Report is an in-depth analysis detailing your home's value as well as a comparison with similar homes in the area
Purchase History
| Date | Buyer | Sale Price | Title Company |
|---|---|---|---|
| Solis Olga | $125,000 | Chicago Title Company | |
| Deutsche Bank National Trust Company | $128,000 | None Available | |
| Contreras Jose | $293,000 | Financial Title Company |
Source: Public Records
Mortgage History
| Date | Status | Borrower | Loan Amount |
|---|---|---|---|
| Previous Owner | Solis Olga | $112,500 | |
| Previous Owner | Contreras Jose | $234,400 |
Source: Public Records
Tax History
| Year | Tax Paid | Tax Assessment Tax Assessment Total Assessment is a certain percentage of the fair market value that is determined by local assessors to be the total taxable value of land and additions on the property. | Land | Improvement |
|---|---|---|---|---|
| 2025 | $2,649 | $160,971 | $51,510 | $109,461 |
| 2024 | $2,649 | $157,815 | $50,500 | $107,315 |
| 2023 | $2,601 | $154,721 | $49,510 | $105,211 |
| 2022 | $2,216 | $151,689 | $48,540 | $103,149 |
| 2021 | $2,510 | $148,714 | $47,588 | $101,126 |
| 2020 | $2,022 | $147,189 | $47,100 | $100,089 |
| 2019 | $1,632 | $144,302 | $46,176 | $98,126 |
| 2018 | $2,417 | $141,473 | $45,271 | $96,202 |
| 2017 | $2,394 | $138,699 | $44,383 | $94,316 |
| 2016 | $2,522 | $135,980 | $43,513 | $92,467 |
| 2015 | $1,674 | $133,937 | $42,859 | $91,078 |
| 2014 | $1,674 | $131,313 | $42,019 | $89,294 |
Source: Public Records
Map
Nearby Homes
- 4038 E Sue Ave
- 4330 E College Ave
- 703 S Grand St
- 3934 E College Ave
- 4016 E Cypress Ave
- 3935 E Myrtle Ave
- 3917 E Myrtle Ave
- 4132 E Kaweah Ave
- 4122 E Kaweah Ave
- 3646 E Meadow Ct
- 807 S McAuliff St
- 3931 E Hillcrest Ave
- 352 S Wind Ct
- 3947 E Cambridge Ave
- 804 S Simon St
- 3934 E Willow Ave
- 3632 E Willow Ct
- 4312 E Stapp Ave
- 2916 E Tulare Ave
- 226 N Amador St
- 4323 E Meadow Ave
- 4303 E Meadow Ave
- 4312 E Sue Ave
- 4302 E Sue Ave
- 4322 E Sue Ave
- 4243 E Meadow Ave
- 4331 E Meadow Ave
- 4318 E Meadow Ave
- 4236 E Sue Ave
- 4334 E Sue Ave
- 4304 E Meadow Ave
- 4324 E Meadow Ave
- 4231 E Meadow Ave
- 4242 E Meadow Ave
- 4332 E Meadow Ave
- 4226 E Sue Ave
- 4232 E Meadow Ave
- 4319 E Westcott Ave
- 4309 E Sue Ave
- 4344 E Meadow Ave
Your Personal Tour Guide
Ask me questions while you tour the home.