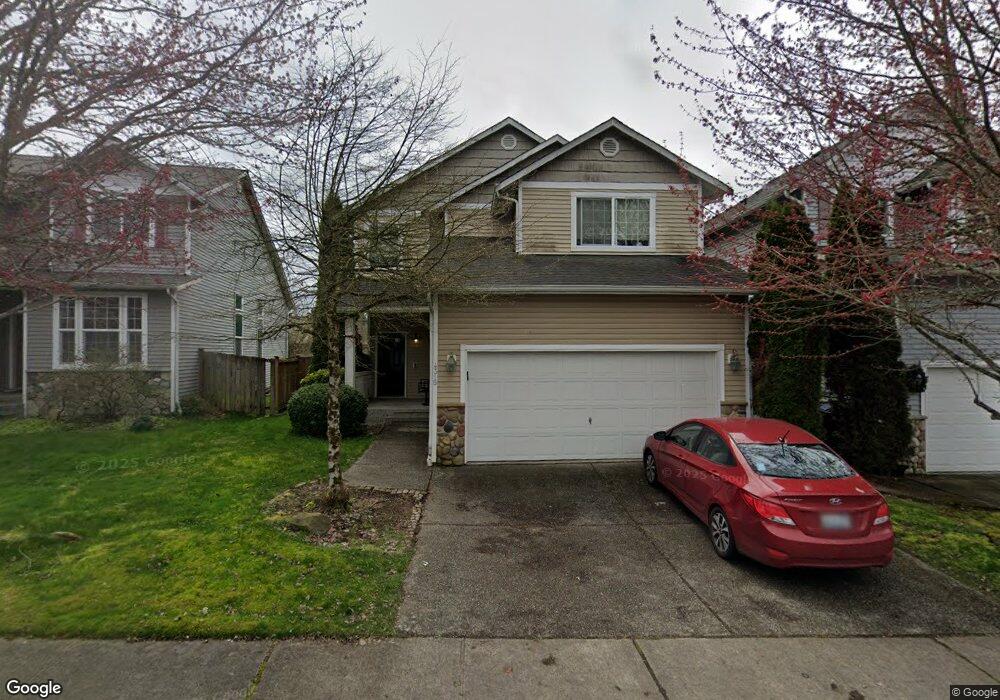
4318 147th Place SE Bothell, WA 98012
Estimated Value: $857,000 - $985,000
4
Beds
3
Baths
2,079
Sq Ft
$444/Sq Ft
Est. Value
About This Home
This home is located at 4318 147th Place SE, Bothell, WA 98012 and is currently estimated at $924,035, approximately $444 per square foot. 4318 147th Place SE is a home located in Snohomish County with nearby schools including Silver Firs Elementary School, Gateway Middle School, and Henry M. Jackson High School.
Ownership History
Date
Name
Owned For
Owner Type
Purchase Details
Closed on
Aug 11, 2006
Sold by
Lones Wesley C and Lones Teresa
Bought by
Lones Wesley C
Current Estimated Value
Purchase Details
Closed on
Jan 17, 2006
Sold by
Orbigo Allan R and Orbigo Ma Concepcion
Bought by
Lones Wesley C and Lones Teresa
Home Financials for this Owner
Home Financials are based on the most recent Mortgage that was taken out on this home.
Original Mortgage
$57,450
Outstanding Balance
$44,595
Interest Rate
6.32%
Mortgage Type
Credit Line Revolving
Estimated Equity
$879,440
Purchase Details
Closed on
Dec 2, 2003
Sold by
Legend Homes Llc
Bought by
Orbigo Allan R and Orbigo Ma Concepcion
Home Financials for this Owner
Home Financials are based on the most recent Mortgage that was taken out on this home.
Original Mortgage
$214,140
Interest Rate
5.75%
Mortgage Type
Purchase Money Mortgage
Create a Home Valuation Report for This Property
The Home Valuation Report is an in-depth analysis detailing your home's value as well as a comparison with similar homes in the area
Purchase History
| Date | Buyer | Sale Price | Title Company |
|---|---|---|---|
| Lones Wesley C | -- | None Available | |
| Lones Wesley C | $383,000 | Stewart | |
| Orbigo Allan R | $267,680 | Chicago Title Insurance Co |
Source: Public Records
Mortgage History
| Date | Status | Borrower | Loan Amount |
|---|---|---|---|
| Open | Lones Wesley C | $57,450 | |
| Open | Lones Wesley C | $306,400 | |
| Previous Owner | Orbigo Allan R | $214,140 | |
| Closed | Orbigo Allan R | $53,540 |
Source: Public Records
Tax History
| Year | Tax Paid | Tax Assessment Tax Assessment Total Assessment is a certain percentage of the fair market value that is determined by local assessors to be the total taxable value of land and additions on the property. | Land | Improvement |
|---|---|---|---|---|
| 2026 | $7,103 | $806,500 | $503,500 | $303,000 |
| 2025 | $6,713 | $747,200 | $456,000 | $291,200 |
| 2024 | $6,713 | $709,300 | $430,700 | $278,600 |
| 2023 | $7,073 | $820,500 | $499,600 | $320,900 |
| 2022 | $6,062 | $608,500 | $300,700 | $307,800 |
| 2020 | $5,859 | $493,500 | $242,300 | $251,200 |
| 2019 | $5,322 | $449,500 | $213,800 | $235,700 |
| 2018 | $5,474 | $421,700 | $194,800 | $226,900 |
| 2017 | $4,827 | $374,800 | $161,500 | $213,300 |
| 2016 | $4,259 | $340,300 | $135,900 | $204,400 |
| 2015 | $4,329 | $328,200 | $127,300 | $200,900 |
| 2013 | $3,757 | $251,500 | $95,000 | $156,500 |
Source: Public Records
Map
Nearby Homes
- 4116 145th Place SE
- 4431 144th Place SE
- 4613 149th Place SE
- 14915 38th Dr SE Unit U1153
- 14915 38th Dr SE Unit 3022
- 14915 38th Dr SE Unit EE2029
- 14915 38th Dr SE Unit 3033
- 14915 38th Dr SE Unit 3025
- 4624 150th Place SE
- 4817 147th Place SE
- 4315 142nd Place SE
- 15314 Sunset Rd
- 15106 48th Ave SE
- 4023 153rd Place SE
- 4408 153rd Place SE
- 15204 48th Ave SE
- 15006 49th Dr SE
- 4921 147th Place SE
- 15013 49th Dr SE
- 3623 148th St SE
- 4314 147th Place SE
- 4320 147th Place SE
- 4310 147th Place SE
- 4326 147th Place SE
- 4328 147th Place SE
- 14725 42nd Dr SE
- 4315 147th Place SE
- 4319 147th Place SE
- 14719 42nd Dr SE
- 4313 147th Place SE
- 4323 147th Place SE
- 4332 147th Place SE
- 4307 147th Place SE
- 4329 147th Place SE
- 4301 147th Place SE
- 4404 147th Place SE
- 4331 147th Place SE
- 14707 42nd Dr SE
- 4405 147th Place SE
- 4412 147th Place SE
Your Personal Tour Guide
Ask me questions while you tour the home.