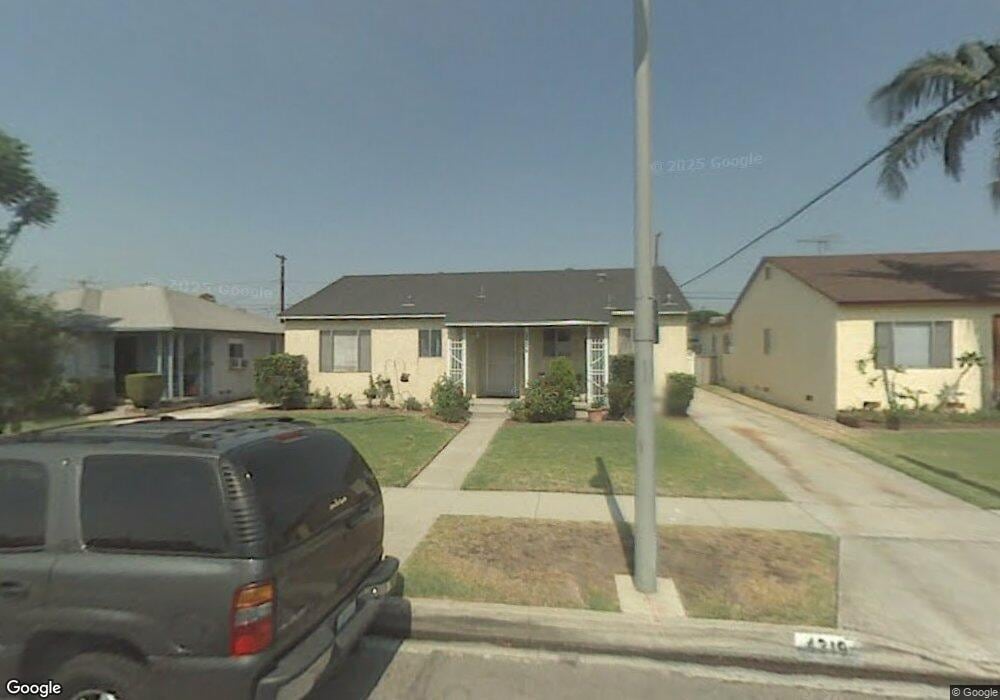
4319 Layman Ave Pico Rivera, CA 90660
Estimated Value: $667,000 - $755,000
3
Beds
1
Bath
1,129
Sq Ft
$631/Sq Ft
Est. Value
About This Home
This home is located at 4319 Layman Ave, Pico Rivera, CA 90660 and is currently estimated at $711,855, approximately $630 per square foot. 4319 Layman Ave is a home located in Los Angeles County with nearby schools including Durfee Elementary School, North Park Middle School, and Ruben Salazar Continuation School.
Ownership History
Date
Name
Owned For
Owner Type
Purchase Details
Closed on
Dec 19, 2025
Sold by
Pancholin Properties Inc
Bought by
Hernandez Crisoforo and Hernandez Elda B
Current Estimated Value
Purchase Details
Closed on
May 21, 2025
Sold by
Hernandez Crisoforo and Hernandez Elda B
Bought by
Pancholin Properties Inc
Purchase Details
Closed on
Jul 14, 2003
Sold by
Salazar Maria
Bought by
Hernandez Cristoforo
Home Financials for this Owner
Home Financials are based on the most recent Mortgage that was taken out on this home.
Original Mortgage
$114,000
Interest Rate
5.17%
Mortgage Type
Purchase Money Mortgage
Purchase Details
Closed on
Feb 2, 1998
Sold by
Delatorre Aida
Bought by
Delatorre Paul
Home Financials for this Owner
Home Financials are based on the most recent Mortgage that was taken out on this home.
Original Mortgage
$117,000
Interest Rate
7.05%
Purchase Details
Closed on
Jan 7, 1998
Sold by
Romero Eleanor J and Delatorre Paul
Bought by
Hernandez Crisoforo
Home Financials for this Owner
Home Financials are based on the most recent Mortgage that was taken out on this home.
Original Mortgage
$117,000
Interest Rate
7.05%
Purchase Details
Closed on
Jan 17, 1997
Sold by
Delatorre Abustina
Bought by
Romero Eleanor J
Create a Home Valuation Report for This Property
The Home Valuation Report is an in-depth analysis detailing your home's value as well as a comparison with similar homes in the area
Home Values in the Area
Average Home Value in this Area
Purchase History
| Date | Buyer | Sale Price | Title Company |
|---|---|---|---|
| Hernandez Crisoforo | -- | None Listed On Document | |
| Pancholin Properties Inc | -- | Title365 | |
| Hernandez Cristoforo | -- | Ticor Title Co | |
| Delatorre Paul | -- | Orange Coast Title | |
| Hernandez Crisoforo | $137,000 | Orange Coast Title | |
| Romero Eleanor J | -- | -- |
Source: Public Records
Mortgage History
| Date | Status | Borrower | Loan Amount |
|---|---|---|---|
| Previous Owner | Hernandez Cristoforo | $114,000 | |
| Previous Owner | Hernandez Crisoforo | $117,000 |
Source: Public Records
Tax History
| Year | Tax Paid | Tax Assessment Tax Assessment Total Assessment is a certain percentage of the fair market value that is determined by local assessors to be the total taxable value of land and additions on the property. | Land | Improvement |
|---|---|---|---|---|
| 2025 | $4,089 | $263,863 | $165,700 | $98,163 |
| 2024 | $4,089 | $258,690 | $162,451 | $96,239 |
| 2023 | $3,979 | $253,618 | $159,266 | $94,352 |
| 2022 | $3,803 | $248,646 | $156,144 | $92,502 |
| 2021 | $3,695 | $243,772 | $153,083 | $90,689 |
| 2019 | $3,667 | $236,544 | $148,544 | $88,000 |
| 2018 | $3,457 | $231,907 | $145,632 | $86,275 |
| 2016 | $3,129 | $222,904 | $139,978 | $82,926 |
| 2015 | $3,084 | $219,557 | $137,876 | $81,681 |
| 2014 | $3,049 | $215,257 | $135,176 | $80,081 |
Source: Public Records
Map
Nearby Homes
- 4288 Rosemead Blvd Unit 25
- 4508 Deland Ave
- 8835 Las Posas St
- 9419 Beverly Blvd
- 4424 Calada Ave
- 8939 Gallatin Rd Unit 16
- 8509 Beverly Blvd Unit 76
- 8509 Beverly Blvd Unit 24
- 4660 Paramount Blvd
- 8630 Elba St
- 4139 Paramount Blvd Unit 18
- 9035 Hightree St
- 9323 Via Azul
- 9329 Via Azul
- 4018 Amistad Ave
- 9335 Via Azul
- 9327 Via Azul
- 9367 Via Azul
- 9318 Via Azul
- 9324 Via Azul
- 4325 Layman Ave
- 4313 Layman Ave
- 4318 Lindell Ave
- 4329 Layman Ave
- 4309 Layman Ave
- 4312 Lindell Ave
- 4324 Lindell Ave
- 4328 Lindell Ave
- 4308 Lindell Ave
- 4303 Layman Ave
- 4335 Layman Ave
- 4318 Layman Ave
- 4324 Layman Ave
- 4312 Layman Ave
- 4334 Lindell Ave
- 4302 Lindell Ave
- 4328 Layman Ave
- 4308 Layman Ave
- 4239 Layman Ave
- 4339 Layman Ave
Your Personal Tour Guide
Ask me questions while you tour the home.