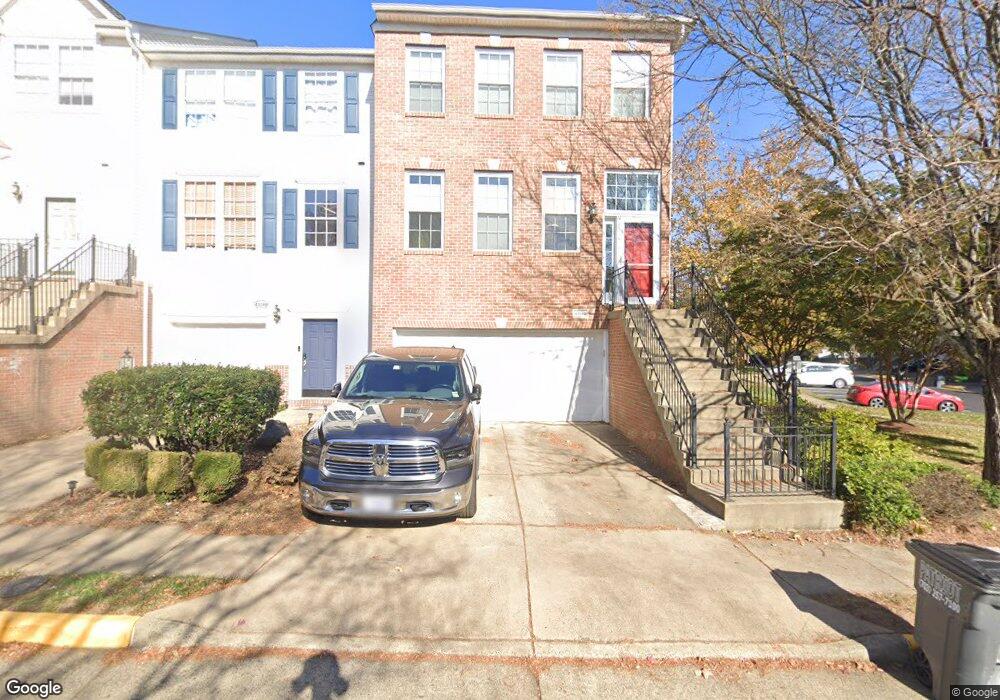
43192 Newbridge Square Broadlands, VA 20148
Estimated Value: $631,000 - $672,000
3
Beds
4
Baths
2,189
Sq Ft
$301/Sq Ft
Est. Value
About This Home
This home is located at 43192 Newbridge Square, Broadlands, VA 20148 and is currently estimated at $659,721, approximately $301 per square foot. 43192 Newbridge Square is a home located in Loudoun County with nearby schools including Hillside Elementary School, Eagle Ridge Middle School, and Briar Woods High School.
Ownership History
Date
Name
Owned For
Owner Type
Purchase Details
Closed on
Aug 20, 2009
Sold by
Ahart Matthew
Bought by
Clarke Christopher S
Current Estimated Value
Home Financials for this Owner
Home Financials are based on the most recent Mortgage that was taken out on this home.
Original Mortgage
$342,678
Outstanding Balance
$223,200
Interest Rate
5.19%
Mortgage Type
FHA
Estimated Equity
$436,521
Purchase Details
Closed on
Dec 12, 2002
Sold by
Eisler Vaughn
Bought by
Ahart Matthew
Home Financials for this Owner
Home Financials are based on the most recent Mortgage that was taken out on this home.
Original Mortgage
$238,000
Interest Rate
6.17%
Mortgage Type
New Conventional
Purchase Details
Closed on
Apr 6, 2000
Sold by
Engle Homes
Bought by
Eisler Vaughn
Home Financials for this Owner
Home Financials are based on the most recent Mortgage that was taken out on this home.
Original Mortgage
$159,850
Interest Rate
8.3%
Create a Home Valuation Report for This Property
The Home Valuation Report is an in-depth analysis detailing your home's value as well as a comparison with similar homes in the area
Home Values in the Area
Average Home Value in this Area
Purchase History
| Date | Buyer | Sale Price | Title Company |
|---|---|---|---|
| Clarke Christopher S | $349,000 | -- | |
| Ahart Matthew | $297,500 | -- | |
| Eisler Vaughn | $205,426 | -- |
Source: Public Records
Mortgage History
| Date | Status | Borrower | Loan Amount |
|---|---|---|---|
| Open | Clarke Christopher S | $342,678 | |
| Previous Owner | Ahart Matthew | $238,000 | |
| Previous Owner | Eisler Vaughn | $159,850 |
Source: Public Records
Tax History Compared to Growth
Tax History
| Year | Tax Paid | Tax Assessment Tax Assessment Total Assessment is a certain percentage of the fair market value that is determined by local assessors to be the total taxable value of land and additions on the property. | Land | Improvement |
|---|---|---|---|---|
| 2025 | $5,094 | $632,750 | $183,500 | $449,250 |
| 2024 | $5,336 | $616,900 | $178,500 | $438,400 |
| 2023 | $4,790 | $547,390 | $178,500 | $368,890 |
| 2022 | $4,857 | $545,780 | $163,500 | $382,280 |
| 2021 | $4,606 | $469,990 | $143,500 | $326,490 |
| 2020 | $4,525 | $437,220 | $143,500 | $293,720 |
| 2019 | $4,337 | $415,070 | $143,500 | $271,570 |
| 2018 | $4,289 | $395,260 | $128,500 | $266,760 |
| 2017 | $4,336 | $385,420 | $128,500 | $256,920 |
| 2016 | $4,334 | $378,550 | $0 | $0 |
| 2015 | $4,393 | $258,550 | $0 | $258,550 |
| 2014 | $4,114 | $227,700 | $0 | $227,700 |
Source: Public Records
Map
Nearby Homes
- 43189 Riders Square
- 43382 Farringdon Square
- 43376 Farringdon Square
- 21360 Shady Wood Terrace
- 43497 Farringdon Square
- 21748 Dollis Hill Terrace
- 21752 Dollis Hill Terrace
- 21823 Beckhorn Station Terrace
- 21843 Beckhorn Station Terrace
- 43234 Farringdon Square
- Cameron 24-R1-RT Plan at Demott and Silver at Broadlands - Demott and Silver
- Collier 24-R1 Plan at Demott and Silver at Broadlands - Demott and Silver
- Collier 24-R1-RT Plan at Demott and Silver at Broadlands - Demott and Silver
- Cameron 24-R1 Plan at Demott and Silver at Broadlands - Demott and Silver
- 43294 Farringdon Square
- 43298 Farringdon Square
- 43302 Farringdon Square
- 40396 Milford Dr
- 21816 Ainsley Ct
- 42920 Cattail Meadows Place
- 43190 Newbridge Square
- 43188 Newbridge Square
- 43186 Newbridge Square
- 43184 Newbridge Square
- 43182 Newbridge Square
- 43185 Riders Square
- 43180 Newbridge Square
- 43187 Riders Square
- 21574 Iredell Terrace
- 43183 Riders Square
- 21568 Iredell Terrace
- 21576 Iredell Terrace
- 21566 Iredell Terrace
- 43191 Riders Square
- 21578 Iredell Terrace
- 43193 Riders Square
- 21564 Iredell Terrace
- 21580 Iredell Terrace
- 21582 Iredell Terrace
- 43195 Riders Square