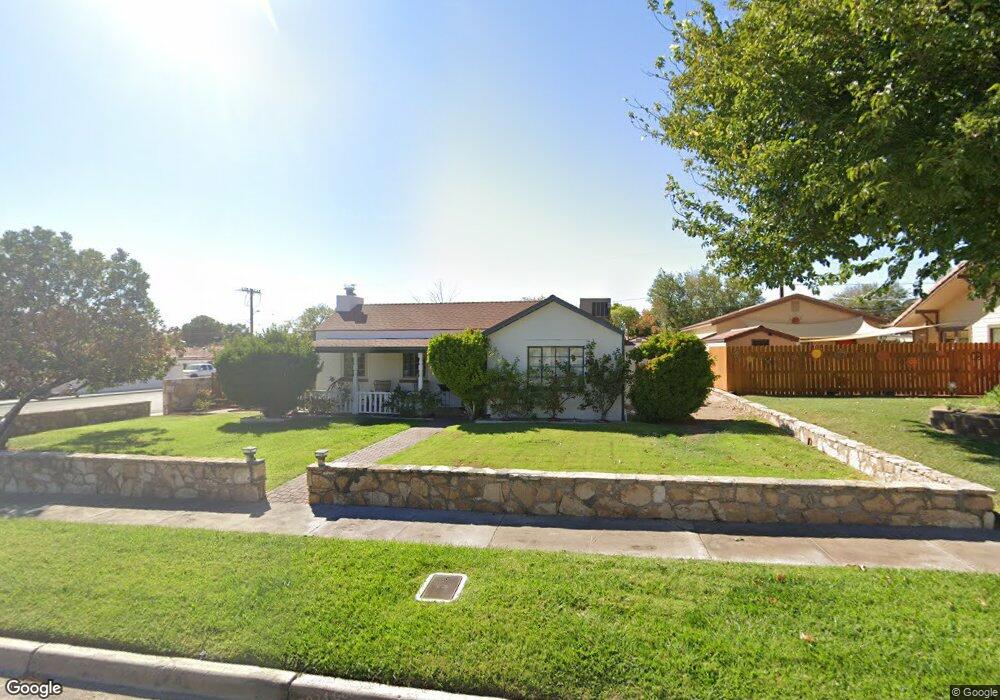
432 Ash St Boulder City, NV 89005
Estimated Value: $386,000 - $408,836
2
Beds
1
Bath
928
Sq Ft
$429/Sq Ft
Est. Value
About This Home
This home is located at 432 Ash St, Boulder City, NV 89005 and is currently estimated at $398,209, approximately $429 per square foot. 432 Ash St is a home located in Clark County with nearby schools including Andrew Mitchell Elementary School, Martha P. King Elementary School, and Elton M. & Madelaine E. Garrett Junior High School.
Ownership History
Date
Name
Owned For
Owner Type
Purchase Details
Closed on
Aug 18, 2021
Sold by
Hanley Heide
Bought by
Hanley Heide and Hanley Family Trust
Current Estimated Value
Purchase Details
Closed on
Mar 26, 2021
Sold by
Prestbo Alf and The Alf Prestbo Jr Trust
Bought by
Hanley Heide
Home Financials for this Owner
Home Financials are based on the most recent Mortgage that was taken out on this home.
Original Mortgage
$256,000
Outstanding Balance
$191,425
Interest Rate
2.8%
Mortgage Type
New Conventional
Estimated Equity
$206,784
Purchase Details
Closed on
Nov 25, 2013
Sold by
Prestbo Alf and Prestbo Alf
Bought by
Prestbo Alf and Alf Prestbo Jr Trust
Purchase Details
Closed on
May 14, 2013
Sold by
Conklin Lisa Marie
Bought by
Prestbo Alf
Purchase Details
Closed on
Aug 7, 2007
Sold by
Prestbo Alf
Bought by
Prestbo Alf and Conklin Lisa Marie
Create a Home Valuation Report for This Property
The Home Valuation Report is an in-depth analysis detailing your home's value as well as a comparison with similar homes in the area
Home Values in the Area
Average Home Value in this Area
Purchase History
| Date | Buyer | Sale Price | Title Company |
|---|---|---|---|
| Hanley Heide | -- | None Available | |
| Hanley Heide | $320,000 | Security 1St Title Of Nev | |
| Prestbo Alf | -- | None Available | |
| Prestbo Alf | -- | None Available | |
| Prestbo Alf | -- | None Available |
Source: Public Records
Mortgage History
| Date | Status | Borrower | Loan Amount |
|---|---|---|---|
| Open | Hanley Heide | $256,000 |
Source: Public Records
Tax History Compared to Growth
Tax History
| Year | Tax Paid | Tax Assessment Tax Assessment Total Assessment is a certain percentage of the fair market value that is determined by local assessors to be the total taxable value of land and additions on the property. | Land | Improvement |
|---|---|---|---|---|
| 2025 | $872 | $69,265 | $53,900 | $15,365 |
| 2024 | $846 | $69,265 | $53,900 | $15,365 |
| 2023 | $691 | $54,287 | $40,425 | $13,862 |
| 2022 | $822 | $48,953 | $36,575 | $12,378 |
| 2021 | $834 | $44,996 | $33,495 | $11,501 |
| 2020 | $775 | $42,740 | $31,570 | $11,170 |
| 2019 | $752 | $39,662 | $28,875 | $10,787 |
| 2018 | $730 | $35,185 | $25,025 | $10,160 |
| 2017 | $866 | $33,169 | $23,100 | $10,069 |
| 2016 | $691 | $27,060 | $17,325 | $9,735 |
| 2015 | $689 | $25,990 | $16,538 | $9,452 |
| 2014 | $669 | $25,140 | $16,538 | $8,602 |
Source: Public Records
Map
Nearby Homes