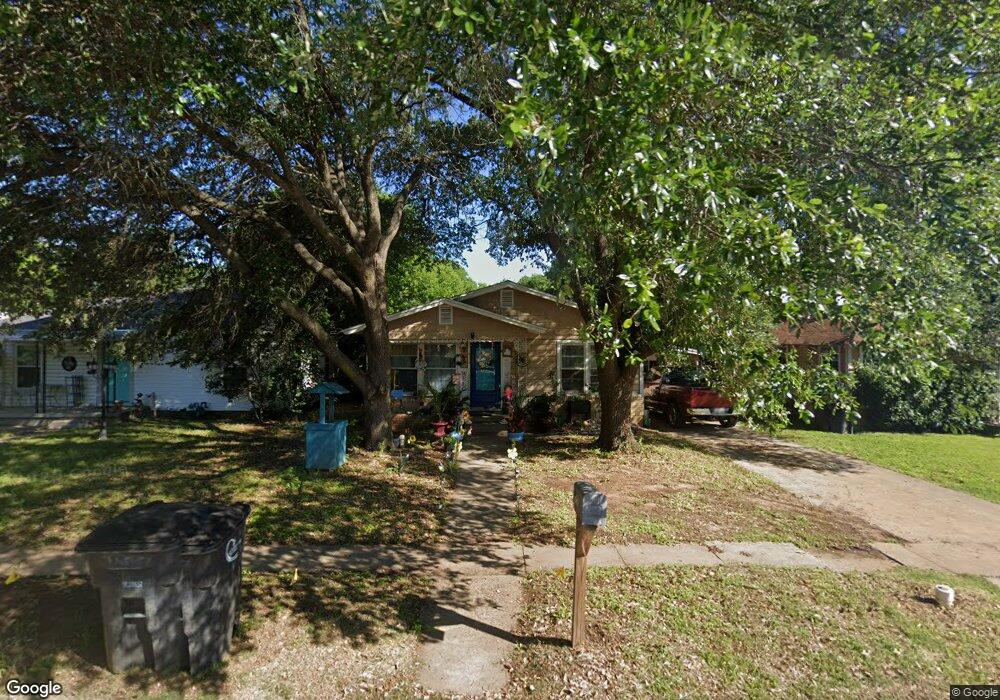
432 Bales St Cleburne, TX 76033
Estimated Value: $179,000 - $189,471
2
Beds
1
Bath
1,016
Sq Ft
$183/Sq Ft
Est. Value
About This Home
This home is located at 432 Bales St, Cleburne, TX 76033 and is currently estimated at $185,618, approximately $182 per square foot. 432 Bales St is a home located in Johnson County with nearby schools including Irving Elementary School, A.D. Wheat Middle School, and Cleburne High School.
Ownership History
Date
Name
Owned For
Owner Type
Purchase Details
Closed on
Aug 10, 2012
Sold by
The Secretary Of Hud
Bought by
Moreno Benito J
Current Estimated Value
Purchase Details
Closed on
Mar 19, 2012
Sold by
Jpmorgan Chase Bank National Association
Bought by
Secretary Of Housing & Urban Development
Purchase Details
Closed on
Feb 16, 2012
Sold by
Truver Christopher M
Bought by
Jpmorgan Chase Bank National Association
Purchase Details
Closed on
Feb 23, 2007
Sold by
Phillips Charles C and Phillips Laverne
Bought by
Truver Christopher M
Home Financials for this Owner
Home Financials are based on the most recent Mortgage that was taken out on this home.
Original Mortgage
$64,351
Interest Rate
6.17%
Mortgage Type
New Conventional
Purchase Details
Closed on
Nov 8, 2006
Sold by
Thomas Delaina Gay
Bought by
Thomas William Clyde
Create a Home Valuation Report for This Property
The Home Valuation Report is an in-depth analysis detailing your home's value as well as a comparison with similar homes in the area
Home Values in the Area
Average Home Value in this Area
Purchase History
| Date | Buyer | Sale Price | Title Company |
|---|---|---|---|
| Moreno Benito J | -- | None Available | |
| Secretary Of Housing & Urban Development | -- | None Available | |
| Secretary Of Hud | -- | None Available | |
| Jpmorgan Chase Bank National Association | $32,400 | Lsi Title Agency Inc | |
| Truver Christopher M | -- | None Available | |
| Thomas William Clyde | -- | None Available |
Source: Public Records
Mortgage History
| Date | Status | Borrower | Loan Amount |
|---|---|---|---|
| Previous Owner | Truver Christopher M | $64,351 |
Source: Public Records
Tax History Compared to Growth
Tax History
| Year | Tax Paid | Tax Assessment Tax Assessment Total Assessment is a certain percentage of the fair market value that is determined by local assessors to be the total taxable value of land and additions on the property. | Land | Improvement |
|---|---|---|---|---|
| 2025 | $4,344 | $194,815 | $28,000 | $166,815 |
| 2024 | $4,344 | $194,815 | $28,000 | $166,815 |
| 2023 | $4,335 | $194,815 | $28,000 | $166,815 |
| 2022 | $2,512 | $100,361 | $28,000 | $72,361 |
| 2021 | $2,619 | $100,361 | $28,000 | $72,361 |
| 2020 | $1,897 | $68,465 | $20,000 | $48,465 |
| 2019 | $2,023 | $68,465 | $20,000 | $48,465 |
| 2018 | $1,546 | $52,305 | $13,000 | $39,305 |
| 2017 | $1,540 | $52,305 | $13,000 | $39,305 |
| 2016 | $1,462 | $49,648 | $11,500 | $38,148 |
| 2015 | $1,323 | $49,648 | $11,500 | $38,148 |
| 2014 | $1,323 | $49,648 | $11,500 | $38,148 |
Source: Public Records
Map
Nearby Homes
- 502 Bales St
- 701 Poindexter Ave
- 308 Poindexter Ave
- 418 Marengo St
- 1103 N Walnut St
- 704 Graham St
- 1204 N Wood St
- 411 Euclid St
- 807 Poindexter Ave
- 800 Madison St
- 607 N Wood St
- 916 Poindexter Ave
- 922 N Buffalo Ave
- 107 Woodard Ave
- 603 Lilly St
- 805 Marengo St
- 5348 State Highway 171 Unit 4
- 808 Marengo St
- 902 Turner St
- 810 Euclid St