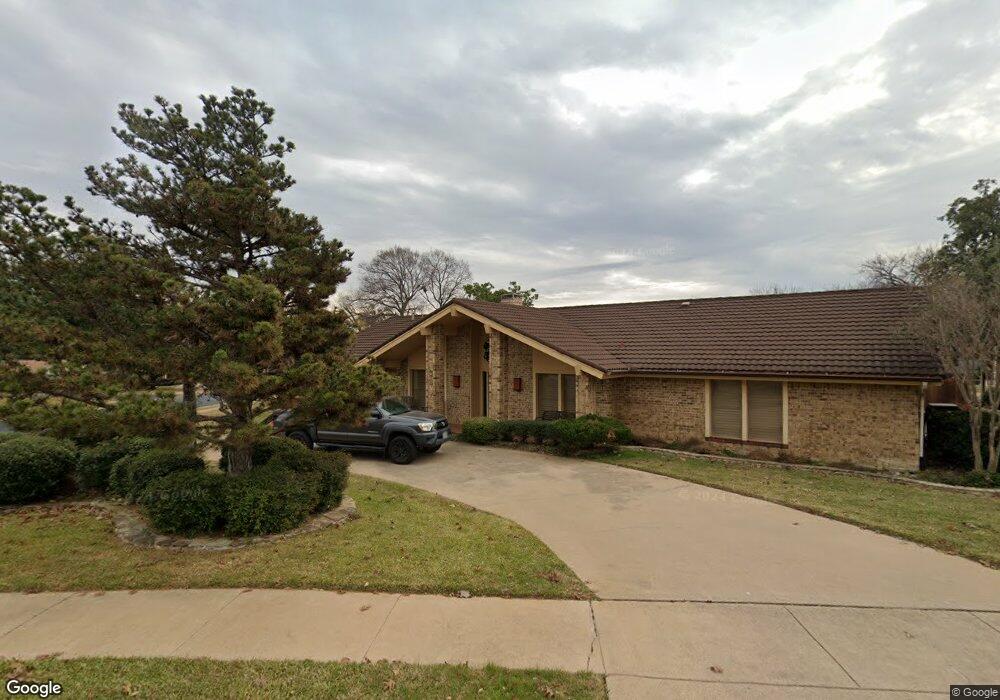
432 Blue Jay Ct Bedford, TX 76021
Estimated Value: $478,000 - $600,000
3
Beds
3
Baths
2,371
Sq Ft
$220/Sq Ft
Est. Value
About This Home
This home is located at 432 Blue Jay Ct, Bedford, TX 76021 and is currently estimated at $521,735, approximately $220 per square foot. 432 Blue Jay Ct is a home located in Tarrant County with nearby schools including Bedford Heights Elementary School, Bedford Junior High School, and L.D. Bell High School.
Ownership History
Date
Name
Owned For
Owner Type
Purchase Details
Closed on
Jul 5, 2019
Sold by
Talor Hollis and Taylor Hollis
Bought by
Johnson Joy D and Johnson Michael A
Current Estimated Value
Home Financials for this Owner
Home Financials are based on the most recent Mortgage that was taken out on this home.
Original Mortgage
$337,725
Outstanding Balance
$296,963
Interest Rate
4%
Mortgage Type
New Conventional
Estimated Equity
$224,772
Purchase Details
Closed on
Apr 24, 2013
Create a Home Valuation Report for This Property
The Home Valuation Report is an in-depth analysis detailing your home's value as well as a comparison with similar homes in the area
Home Values in the Area
Average Home Value in this Area
Purchase History
| Date | Buyer | Sale Price | Title Company |
|---|---|---|---|
| Johnson Joy D | -- | None Available | |
| -- | -- | -- | |
| -- | -- | -- |
Source: Public Records
Mortgage History
| Date | Status | Borrower | Loan Amount |
|---|---|---|---|
| Open | Johnson Joy D | $337,725 |
Source: Public Records
Tax History Compared to Growth
Tax History
| Year | Tax Paid | Tax Assessment Tax Assessment Total Assessment is a certain percentage of the fair market value that is determined by local assessors to be the total taxable value of land and additions on the property. | Land | Improvement |
|---|---|---|---|---|
| 2025 | $7,046 | $458,961 | $100,000 | $358,961 |
| 2024 | $7,046 | $458,961 | $100,000 | $358,961 |
| 2023 | $7,512 | $451,250 | $75,000 | $376,250 |
| 2022 | $7,777 | $356,056 | $75,000 | $281,056 |
| 2021 | $8,211 | $348,572 | $75,000 | $273,572 |
| 2020 | $7,901 | $332,313 | $75,000 | $257,313 |
| 2019 | $7,430 | $321,940 | $75,000 | $246,940 |
| 2018 | $2,849 | $278,046 | $75,000 | $203,046 |
| 2017 | $6,115 | $276,097 | $45,000 | $231,097 |
| 2016 | $5,559 | $266,387 | $45,000 | $221,387 |
| 2015 | $2,834 | $208,900 | $26,000 | $182,900 |
| 2014 | $2,834 | $208,900 | $26,000 | $182,900 |
Source: Public Records
Map
Nearby Homes
- 320 Blue Quail Ct
- 305 Warbler Dr
- 3213 Spring Valley Dr
- 405 Woodbriar Ct
- 3605 Spring Valley Dr
- 3119 Spring Grove Dr
- 913 Kensington Ct
- 3609 Wayne Ct
- 801 Shady Creek Ln
- 432 Sunnybrook Ct
- 628 Huntwich Dr
- 3624 Wayne Ct
- 909 Brestol Ct W
- 922 Shady Creek Ln
- 1013 Springdale Rd
- 817 Shady Lake Dr
- 1109 Simpson Terrace
- 3713 Brentwood Ct
- 2704 Shady Grove Dr
- 121 Kay Ct