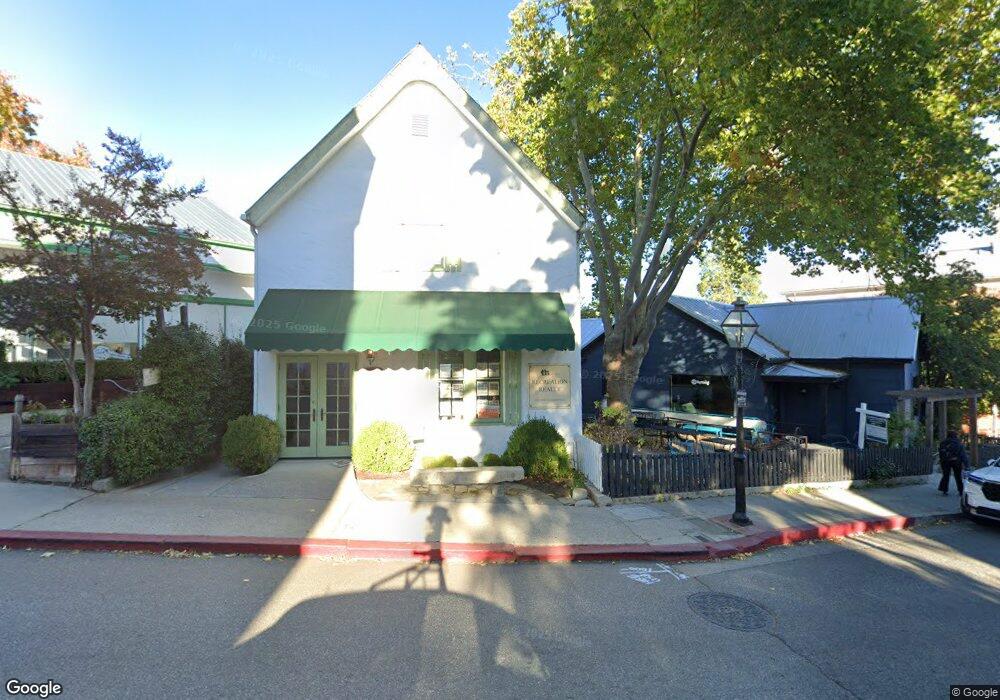
432 Broad St Nevada City, CA 95959
Estimated Value: $987,132
--
Bed
--
Bath
2,800
Sq Ft
$353/Sq Ft
Est. Value
About This Home
This home is located at 432 Broad St, Nevada City, CA 95959 and is currently estimated at $987,132, approximately $352 per square foot. 432 Broad St is a home located in Nevada County with nearby schools including Deer Creek Elementary School, Seven Hills Intermediate School, and Forest Charter School.
Ownership History
Date
Name
Owned For
Owner Type
Purchase Details
Closed on
Oct 29, 2017
Sold by
Toney Lee Ann
Bought by
432 Broad Street Llc
Current Estimated Value
Purchase Details
Closed on
Feb 19, 2015
Sold by
Toney Jon
Bought by
Toney Lee Ann
Purchase Details
Closed on
Sep 10, 2012
Sold by
Warburton Robert J and Warburton Konnie L
Bought by
Dodson Norman R and The Norman R Dodson Trust
Purchase Details
Closed on
Dec 6, 2011
Sold by
Warburton Robert J and Warburton Konnie L
Bought by
Warburton Robert J and Warburton Konnie L
Create a Home Valuation Report for This Property
The Home Valuation Report is an in-depth analysis detailing your home's value as well as a comparison with similar homes in the area
Home Values in the Area
Average Home Value in this Area
Purchase History
| Date | Buyer | Sale Price | Title Company |
|---|---|---|---|
| 432 Broad Street Llc | -- | None Available | |
| Toney Lee Ann | -- | Placer Title Company | |
| Toney Lee Ann | $555,000 | Placer Title Company | |
| Dodson Norman R | $460,000 | Placer Title Company | |
| Warburton Robert J | -- | None Available |
Source: Public Records
Tax History Compared to Growth
Tax History
| Year | Tax Paid | Tax Assessment Tax Assessment Total Assessment is a certain percentage of the fair market value that is determined by local assessors to be the total taxable value of land and additions on the property. | Land | Improvement |
|---|---|---|---|---|
| 2025 | $7,000 | $667,017 | $210,318 | $456,699 |
| 2024 | $6,873 | $653,940 | $206,195 | $447,745 |
| 2023 | $6,873 | $641,118 | $202,152 | $438,966 |
| 2022 | $6,737 | $628,548 | $198,189 | $430,359 |
| 2021 | $6,614 | $616,224 | $194,303 | $421,921 |
| 2020 | $6,605 | $609,906 | $192,311 | $417,595 |
| 2019 | $6,476 | $597,948 | $188,541 | $409,407 |
| 2018 | $6,354 | $586,225 | $184,845 | $401,380 |
| 2017 | $6,237 | $574,731 | $181,221 | $393,510 |
| 2016 | $6,014 | $563,463 | $177,668 | $385,795 |
| 2015 | $5,069 | $471,320 | $163,937 | $307,383 |
| 2014 | $5,069 | $462,088 | $160,726 | $301,362 |
Source: Public Records
Map
Nearby Homes