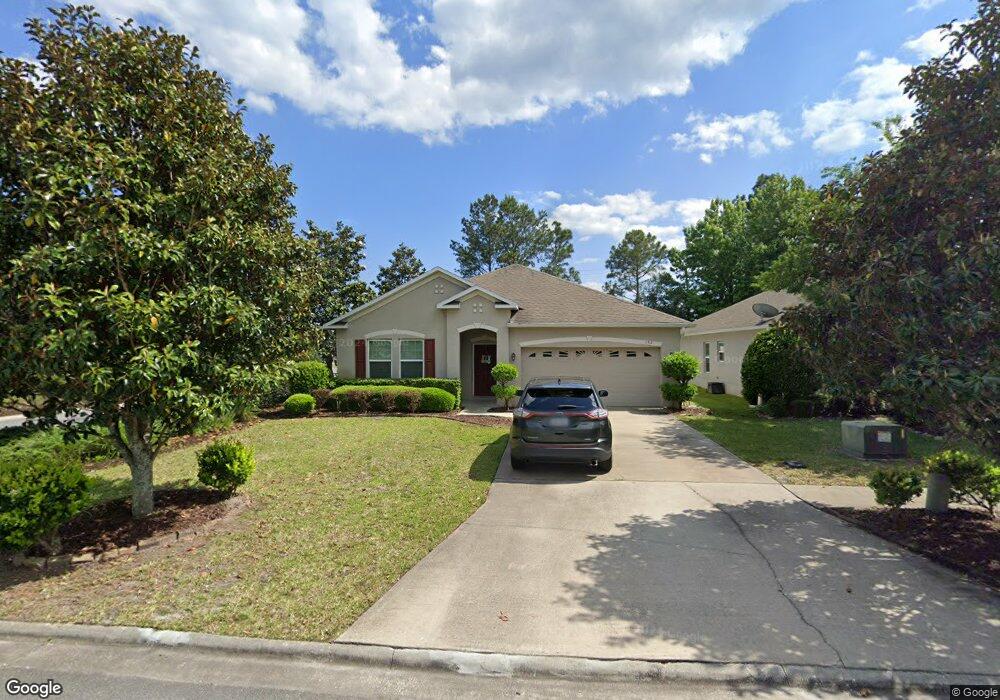
432 Brooklet Cir Unit 1 Saint Marys, GA 31558
Estimated Value: $312,707 - $356,000
3
Beds
2
Baths
1,988
Sq Ft
$166/Sq Ft
Est. Value
About This Home
This home is located at 432 Brooklet Cir Unit 1, Saint Marys, GA 31558 and is currently estimated at $330,677, approximately $166 per square foot. 432 Brooklet Cir Unit 1 is a home located in Camden County with nearby schools including Sugarmill Elementary School, Saint Marys Middle School, and Camden County High School.
Ownership History
Date
Name
Owned For
Owner Type
Purchase Details
Closed on
Jun 29, 2020
Sold by
Martensen John A
Bought by
Vanderburg Sarah and Vanderburg Steven E
Current Estimated Value
Home Financials for this Owner
Home Financials are based on the most recent Mortgage that was taken out on this home.
Original Mortgage
$207,727
Outstanding Balance
$184,199
Interest Rate
3.1%
Mortgage Type
FHA
Estimated Equity
$146,478
Purchase Details
Closed on
Jun 28, 2013
Sold by
Maronda Homes Inc Of Georg
Bought by
Martensen John A and Martensen Dina A
Home Financials for this Owner
Home Financials are based on the most recent Mortgage that was taken out on this home.
Original Mortgage
$173,250
Interest Rate
3.79%
Mortgage Type
VA
Purchase Details
Closed on
Feb 7, 2007
Sold by
Not Provided
Bought by
Maronda Homes Inc
Purchase Details
Closed on
Jan 16, 2006
Sold by
Not Provided
Bought by
Maronda Homes Inc
Create a Home Valuation Report for This Property
The Home Valuation Report is an in-depth analysis detailing your home's value as well as a comparison with similar homes in the area
Home Values in the Area
Average Home Value in this Area
Purchase History
| Date | Buyer | Sale Price | Title Company |
|---|---|---|---|
| Vanderburg Sarah | $214,900 | -- | |
| Martensen John A | $173,250 | -- | |
| Maronda Homes Inc | -- | -- | |
| Maronda Homes Inc | $320,000 | -- |
Source: Public Records
Mortgage History
| Date | Status | Borrower | Loan Amount |
|---|---|---|---|
| Open | Vanderburg Sarah | $207,727 | |
| Previous Owner | Martensen John A | $173,250 |
Source: Public Records
Tax History Compared to Growth
Tax History
| Year | Tax Paid | Tax Assessment Tax Assessment Total Assessment is a certain percentage of the fair market value that is determined by local assessors to be the total taxable value of land and additions on the property. | Land | Improvement |
|---|---|---|---|---|
| 2024 | $2,770 | $120,284 | $8,000 | $112,284 |
| 2023 | $2,867 | $120,284 | $8,000 | $112,284 |
| 2022 | $2,122 | $102,640 | $8,000 | $94,640 |
| 2021 | $2,217 | $86,797 | $8,000 | $78,797 |
| 2020 | $2,433 | $76,545 | $8,000 | $68,545 |
| 2019 | $2,433 | $76,545 | $8,000 | $68,545 |
| 2018 | $498 | $76,545 | $8,000 | $68,545 |
| 2017 | $2,175 | $79,734 | $10,000 | $69,734 |
| 2016 | $2,141 | $71,498 | $6,000 | $65,498 |
| 2015 | $1,883 | $64,948 | $6,000 | $58,948 |
| 2014 | $1,874 | $64,948 | $6,000 | $58,948 |
Source: Public Records
Map
Nearby Homes
- 122 Brooklet Cir
- 322 Brooklet Cir
- 318 Brooklet Cir
- 310 Brooklet Cir
- 212 Brooklet Cir
- 495 Eagle Blvd
- Dayton Plan at Windwood Estates
- Spring Valley II Plan at Windwood Estates
- Richmond Plan at Windwood Estates
- Sea Drift Plan at Windwood Estates
- Bismarck II Plan at Windwood Estates
- Seneca Plan at Windwood Estates
- Avery Plan at Windwood Estates
- Harborside Plan at Windwood Estates
- Pinehurst II Plan at Windwood Estates
- Kennebunk Plan at Windwood Estates
- Crestview Plan at Windwood Estates
- 491 Eagle Blvd
- 490 Eagle Blvd
- 105 Serpentine Dr
- 432 Brooklet Cir
- 430 Brooklet Cir
- 428 Brooklet Cir
- 426 Brooklet Cir
- 427 Brooklet Cir
- 424 Brooklet Cir
- 102 Brooklet Cir Unit 80
- 104 Brooklet Cir Unit 79
- 104 Brooklet Cir
- 422 Brooklet Cir
- 425 Brooklet Cir
- 423 Brooklet Cir
- 106 Brooklet Cir Unit 78
- 106 Brooklet Cir
- 420 Brooklet Cir
- 105 Brooklet Cir
- 419 Brooklet Cir Unit 85
- 419 Brooklet Cir
- 107 Brooklet Cir
- 417 Brooklet Cir