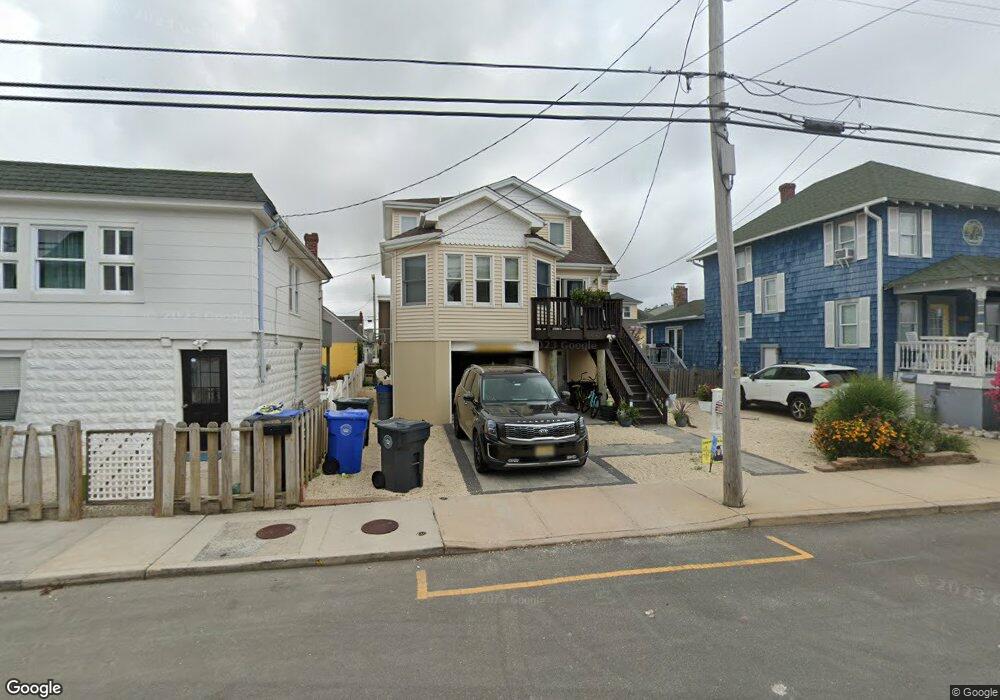
432 Dock Rd Beach Haven, NJ 08008
Long Beach Island NeighborhoodEstimated Value: $1,018,000 - $1,412,000
2
Beds
2
Baths
900
Sq Ft
$1,324/Sq Ft
Est. Value
About This Home
This home is located at 432 Dock Rd, Beach Haven, NJ 08008 and is currently estimated at $1,191,817, approximately $1,324 per square foot. 432 Dock Rd is a home located in Ocean County with nearby schools including Beach Haven School, Southern Regional Middle School, and Southern Regional High School.
Ownership History
Date
Name
Owned For
Owner Type
Purchase Details
Closed on
Jul 18, 2008
Sold by
Smith Stanley and Smith Mary
Bought by
Odonnell Patrick and Odonnell Meredith L
Current Estimated Value
Home Financials for this Owner
Home Financials are based on the most recent Mortgage that was taken out on this home.
Original Mortgage
$380,000
Outstanding Balance
$249,218
Interest Rate
6.4%
Mortgage Type
Purchase Money Mortgage
Estimated Equity
$942,599
Purchase Details
Closed on
Feb 19, 2004
Sold by
Deely Anthony E and Deely Catherine
Bought by
Hodgson Building Contractors
Create a Home Valuation Report for This Property
The Home Valuation Report is an in-depth analysis detailing your home's value as well as a comparison with similar homes in the area
Home Values in the Area
Average Home Value in this Area
Purchase History
| Date | Buyer | Sale Price | Title Company |
|---|---|---|---|
| Odonnell Patrick | $530,000 | None Available | |
| Hodgson Building Contractors | $280,000 | None Available |
Source: Public Records
Mortgage History
| Date | Status | Borrower | Loan Amount |
|---|---|---|---|
| Open | Odonnell Patrick | $380,000 |
Source: Public Records
Tax History
| Year | Tax Paid | Tax Assessment Tax Assessment Total Assessment is a certain percentage of the fair market value that is determined by local assessors to be the total taxable value of land and additions on the property. | Land | Improvement |
|---|---|---|---|---|
| 2025 | $8,874 | $622,300 | $332,300 | $290,000 |
| 2024 | $7,536 | $622,300 | $332,300 | $290,000 |
| 2023 | $7,001 | $622,300 | $332,300 | $290,000 |
| 2022 | $5,403 | $480,300 | $332,300 | $148,000 |
| 2021 | $5,269 | $480,300 | $332,300 | $148,000 |
| 2020 | $5,384 | $480,300 | $332,300 | $148,000 |
| 2019 | $5,230 | $480,300 | $332,300 | $148,000 |
| 2018 | $5,413 | $480,300 | $332,300 | $148,000 |
| 2017 | $5,168 | $480,300 | $332,300 | $148,000 |
| 2016 | $5,777 | $435,700 | $289,600 | $146,100 |
| 2015 | $5,529 | $435,700 | $289,600 | $146,100 |
| 2014 | $5,228 | $435,700 | $289,600 | $146,100 |
Source: Public Records
Map
Nearby Homes
- 444 Engleside Ave Unit U2
- 500 UNIT 3 Engleside Ave
- 409 3rd St
- 320 3rd St
- 225 E Fourth
- 225 4th St
- 415 N Bay Ave Unit 4
- 415 N Bay Ave Unit 1
- 415 N Bay Ave Unit 3
- 415 N Bay Ave Unit 2
- 510 N Bay Ave Unit 2-10
- 601 N Del Ave Unit 12
- 301 N Beach Ave
- 109 Centre St
- 218 7th St Unit A
- 402 Taylor Ave Unit 10
- 106 5th St
- 514 N Atlantic Ave
- 23 5th St
- 706 S Bay Ave
Your Personal Tour Guide
Ask me questions while you tour the home.