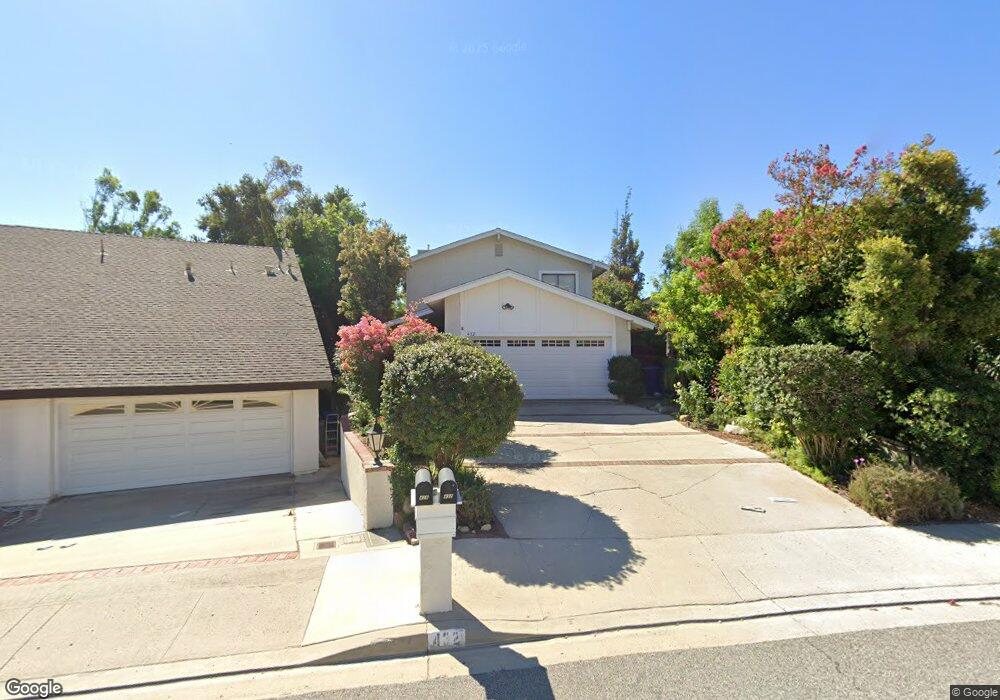
432 Grand Oak Ln Thousand Oaks, CA 91360
Estimated Value: $1,123,000 - $1,341,000
3
Beds
3
Baths
2,012
Sq Ft
$592/Sq Ft
Est. Value
About This Home
This home is located at 432 Grand Oak Ln, Thousand Oaks, CA 91360 and is currently estimated at $1,190,283, approximately $591 per square foot. 432 Grand Oak Ln is a home located in Ventura County with nearby schools including Acacia Elementary School, Redwood Middle School, and Thousand Oaks High School.
Ownership History
Date
Name
Owned For
Owner Type
Purchase Details
Closed on
Apr 12, 2001
Sold by
Greco Rosa
Bought by
Greco Sam
Current Estimated Value
Home Financials for this Owner
Home Financials are based on the most recent Mortgage that was taken out on this home.
Original Mortgage
$275,000
Outstanding Balance
$101,074
Interest Rate
6.98%
Estimated Equity
$1,089,209
Purchase Details
Closed on
Aug 23, 2000
Sold by
Greco Rosa
Bought by
Greco Sam
Home Financials for this Owner
Home Financials are based on the most recent Mortgage that was taken out on this home.
Original Mortgage
$278,400
Interest Rate
8.2%
Purchase Details
Closed on
Jul 13, 2000
Sold by
Stohlman Mark E
Bought by
Greco Sam
Home Financials for this Owner
Home Financials are based on the most recent Mortgage that was taken out on this home.
Original Mortgage
$278,400
Interest Rate
8.2%
Create a Home Valuation Report for This Property
The Home Valuation Report is an in-depth analysis detailing your home's value as well as a comparison with similar homes in the area
Home Values in the Area
Average Home Value in this Area
Purchase History
| Date | Buyer | Sale Price | Title Company |
|---|---|---|---|
| Greco Sam | -- | American Title Co | |
| Greco Sam | -- | -- | |
| Greco Sam | -- | American Title Co | |
| Greco Sam | $348,000 | American Title Co |
Source: Public Records
Mortgage History
| Date | Status | Borrower | Loan Amount |
|---|---|---|---|
| Open | Greco Sam | $275,000 | |
| Previous Owner | Greco Sam | $278,400 | |
| Closed | Greco Sam | $34,800 | |
| Closed | Greco Sam | $38,200 |
Source: Public Records
Tax History Compared to Growth
Tax History
| Year | Tax Paid | Tax Assessment Tax Assessment Total Assessment is a certain percentage of the fair market value that is determined by local assessors to be the total taxable value of land and additions on the property. | Land | Improvement |
|---|---|---|---|---|
| 2025 | $5,864 | $524,350 | $209,738 | $314,612 |
| 2024 | $5,864 | $514,069 | $205,625 | $308,444 |
| 2023 | $5,685 | $503,990 | $201,593 | $302,397 |
| 2022 | $5,583 | $494,108 | $197,640 | $296,468 |
| 2021 | $5,486 | $484,420 | $193,765 | $290,655 |
| 2020 | $5,060 | $479,455 | $191,779 | $287,676 |
| 2019 | $4,926 | $470,055 | $188,019 | $282,036 |
| 2018 | $4,826 | $460,839 | $184,333 | $276,506 |
| 2017 | $4,732 | $451,804 | $180,719 | $271,085 |
| 2016 | $4,687 | $442,946 | $177,176 | $265,770 |
| 2015 | $4,604 | $436,294 | $174,515 | $261,779 |
| 2014 | $4,538 | $427,750 | $171,098 | $256,652 |
Source: Public Records
Map
Nearby Homes
- 1229 Monte Sereno Dr
- 762 Tuolumne Ave
- 327 Chestnut Hill Ct Unit 22
- 385 Somerset Cir
- 286 Oakleaf Dr Unit 23
- 460 Arbor Lane Ct Unit 203
- 240 W Gainsborough Rd
- 615 Camino Verde
- 1449 Fordham Ave
- 291 Sequoia Ct Unit 13
- 248 Oakleaf Dr Unit 107
- 769 Birchpark Cir Unit 101
- 769 Birchpark Cir Unit 203
- 255 Sequoia Ct Unit 21
- 788 Pinetree Cir Unit 13
- 245 Oakleaf Dr Unit 205
- 603 Racquet Club Ln
- 809 Shadow Lake Dr
- 426 Grand Oak Ln
- 444 Grand Oak Ln
- 450 Grand Oak Ln
- 438 Grand Oak Ln
- 420 Grand Oak Ln
- 443 Grand Oak Ln
- 437 Grand Oak Ln
- 456 Grand Oak Ln
- 449 Grand Oak Ln
- 414 Grand Oak Ln
- 431 Grand Oak Ln
- 462 Grand Oak Ln
- 408 Grand Oak Ln
- 461 Grand Oak Ln
- 468 Grand Oak Ln
- 425 Grand Oak Ln
- 467 Grand Oak Ln
- 474 Grand Oak Ln
- 455 Grand Oak Ln
- 402 Grand Oak Ln