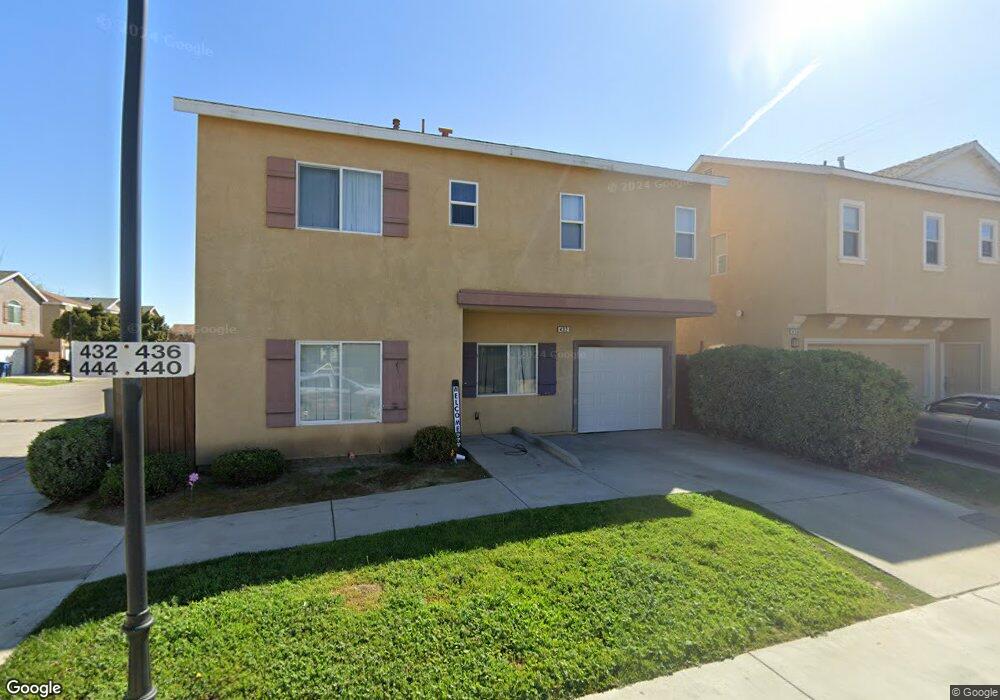
432 Olive Way Chowchilla, CA 93610
Estimated Value: $332,361 - $431,000
4
Beds
3
Baths
1,530
Sq Ft
$242/Sq Ft
Est. Value
About This Home
This home is located at 432 Olive Way, Chowchilla, CA 93610 and is currently estimated at $369,840, approximately $241 per square foot. 432 Olive Way is a home with nearby schools including Merle L. Fuller Elementary School, Stephens Elementary School, and Ronald Reagan Elementary School.
Ownership History
Date
Name
Owned For
Owner Type
Purchase Details
Closed on
Mar 13, 2025
Sold by
Collector Of Chowchilla Water District
Bought by
Chowchilla Water District
Current Estimated Value
Purchase Details
Closed on
Mar 24, 2021
Sold by
Collector Of Chowchilla Water District
Bought by
Olivero Ranch Llc
Purchase Details
Closed on
Feb 2, 2011
Sold by
Omni Financial Llc
Bought by
Olivero Ranch Llc
Home Financials for this Owner
Home Financials are based on the most recent Mortgage that was taken out on this home.
Original Mortgage
$10,000,000
Outstanding Balance
$6,833,013
Interest Rate
4.75%
Mortgage Type
Purchase Money Mortgage
Estimated Equity
-$6,463,173
Purchase Details
Closed on
Jan 2, 2009
Sold by
Penfield Benjamin and Penfield Jethalyn
Bought by
Omni Financial Llc
Purchase Details
Closed on
Mar 12, 2007
Sold by
Propertys Benjamin and Propertys Jethalyn
Bought by
Chowchilla Water District
Create a Home Valuation Report for This Property
The Home Valuation Report is an in-depth analysis detailing your home's value as well as a comparison with similar homes in the area
Home Values in the Area
Average Home Value in this Area
Purchase History
| Date | Buyer | Sale Price | Title Company |
|---|---|---|---|
| Chowchilla Water District | -- | -- | |
| Olivero Ranch Llc | -- | -- | |
| Olivero Ranch Llc | $982,500 | Fidelity National Title Comp | |
| Omni Financial Llc | $200,000 | None Available | |
| Chowchilla Water District | -- | None Available |
Source: Public Records
Mortgage History
| Date | Status | Borrower | Loan Amount |
|---|---|---|---|
| Open | Olivero Ranch Llc | $10,000,000 |
Source: Public Records
Tax History
| Year | Tax Paid | Tax Assessment Tax Assessment Total Assessment is a certain percentage of the fair market value that is determined by local assessors to be the total taxable value of land and additions on the property. | Land | Improvement |
|---|---|---|---|---|
| 2025 | $121 | $166,178 | $40,579 | $125,599 |
| 2023 | $121 | $159,727 | $39,004 | $120,723 |
| 2022 | $121 | $156,596 | $38,240 | $118,356 |
| 2021 | $121 | $153,527 | $37,491 | $116,036 |
| 2020 | $121 | $151,954 | $37,107 | $114,847 |
| 2019 | $121 | $148,976 | $36,380 | $112,596 |
| 2018 | $121 | $146,056 | $35,667 | $110,389 |
| 2017 | $127 | $143,193 | $34,968 | $108,225 |
| 2016 | $127 | $140,386 | $34,283 | $106,103 |
| 2015 | $121 | $138,279 | $33,769 | $104,510 |
| 2014 | $121 | $135,571 | $33,108 | $102,463 |
Source: Public Records
Map
Nearby Homes
- 0 Avenue 25
- 1604 Parkridge Dr
- 344 Rose Ave
- 510 Parkridge Dr
- 175 Oleander Dr
- 2103 Kennedy Ct
- 1116 Sonoma Ave
- 1108 Kings Ave
- 547 Blossom Dr
- 1105 Orange Ave
- 904 Riverside Ave
- 801 Riverside Ave
- 808 Ventura Ave
- 715 Rosehill Dr
- 609 Monterey Ave
- 620 Colusa Ave
- 446 Trinity Ave
- 416 Trinity Ave
- 316 Sonoma Ave
- 212 Sonoma Ave
Your Personal Tour Guide
Ask me questions while you tour the home.