432 S 100 W Kouts, IN 46347
Porter County NeighborhoodEstimated Value: $578,000 - $989,419
4
Beds
5
Baths
3,246
Sq Ft
$241/Sq Ft
Est. Value
About This Home
This home is located at 432 S 100 W, Kouts, IN 46347 and is currently estimated at $783,710, approximately $241 per square foot. 432 S 100 W is a home with nearby schools including Porter Lakes Elementary School, Boone Grove Elementary School, and Boone Grove Middle School.
Ownership History
Date
Name
Owned For
Owner Type
Purchase Details
Closed on
Dec 29, 2015
Sold by
Freyenberger Aaron
Bought by
Freyenberger Aaron and Freyenberger Kari
Current Estimated Value
Home Financials for this Owner
Home Financials are based on the most recent Mortgage that was taken out on this home.
Original Mortgage
$210,668
Interest Rate
3.96%
Mortgage Type
Farmers Home Administration
Purchase Details
Closed on
Feb 26, 2015
Sold by
Keith Freyenberger Trust
Bought by
Freyenberger Aaron
Create a Home Valuation Report for This Property
The Home Valuation Report is an in-depth analysis detailing your home's value as well as a comparison with similar homes in the area
Home Values in the Area
Average Home Value in this Area
Purchase History
| Date | Buyer | Sale Price | Title Company |
|---|---|---|---|
| Freyenberger Aaron | -- | Chicago Title Company Llc | |
| Freyenberger Aaron | -- | None Available |
Source: Public Records
Mortgage History
| Date | Status | Borrower | Loan Amount |
|---|---|---|---|
| Closed | Freyenberger Aaron | $210,668 |
Source: Public Records
Tax History Compared to Growth
Tax History
| Year | Tax Paid | Tax Assessment Tax Assessment Total Assessment is a certain percentage of the fair market value that is determined by local assessors to be the total taxable value of land and additions on the property. | Land | Improvement |
|---|---|---|---|---|
| 2024 | $7,514 | $929,700 | $86,500 | $843,200 |
| 2023 | $7,374 | $858,000 | $78,100 | $779,900 |
| 2022 | $7,432 | $784,200 | $76,500 | $707,700 |
| 2021 | $7,247 | $728,100 | $75,700 | $652,400 |
| 2020 | $6,429 | $694,200 | $66,300 | $627,900 |
| 2019 | $6,302 | $637,400 | $67,300 | $570,100 |
| 2018 | $6,032 | $611,200 | $67,500 | $543,700 |
| 2017 | $4,602 | $537,200 | $68,500 | $468,700 |
| 2016 | $2,798 | $184,800 | $75,300 | $109,500 |
| 2014 | $311 | $19,000 | $16,700 | $2,300 |
Source: Public Records
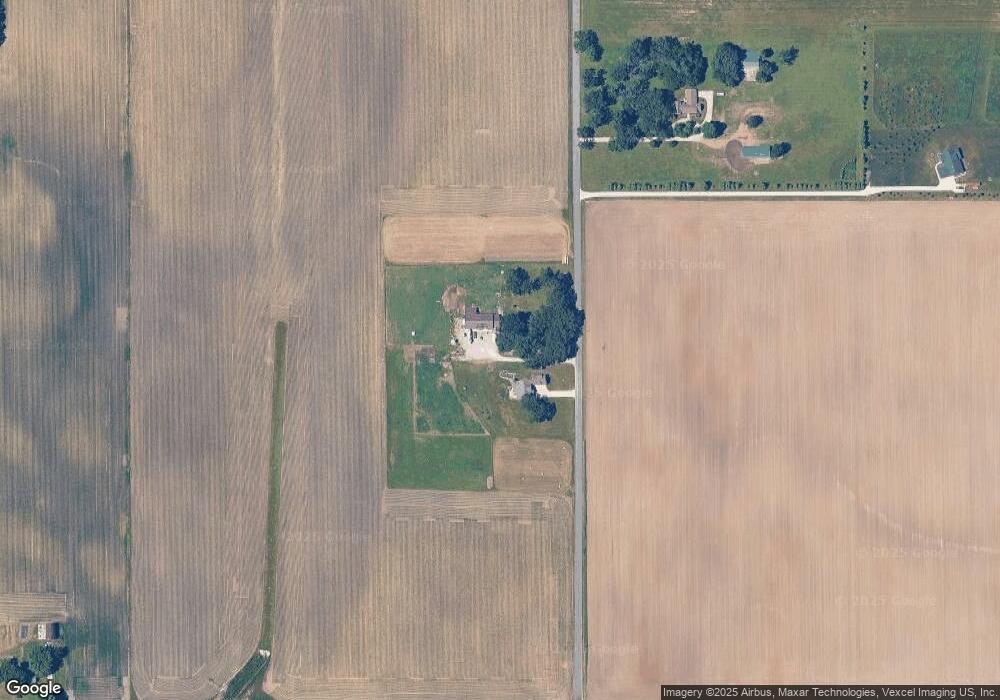
Map
Nearby Homes