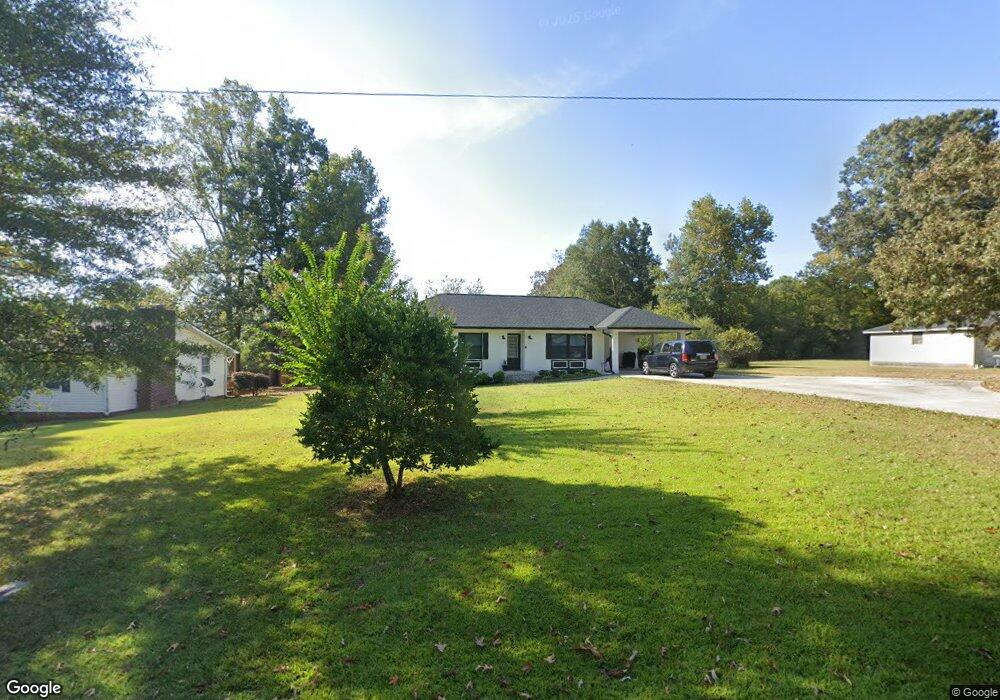
432 Sally Ann Cir Bowdon, GA 30108
Estimated Value: $205,000 - $289,000
3
Beds
2
Baths
1,361
Sq Ft
$187/Sq Ft
Est. Value
About This Home
This home is located at 432 Sally Ann Cir, Bowdon, GA 30108 and is currently estimated at $254,716, approximately $187 per square foot. 432 Sally Ann Cir is a home located in Carroll County with nearby schools including Bowdon Elementary School, Bowdon Middle School, and Bowdon High School.
Ownership History
Date
Name
Owned For
Owner Type
Purchase Details
Closed on
Oct 31, 2019
Sold by
Jakson James Bradley
Bought by
Jakson James Bradley and Jackson Dina Renee
Current Estimated Value
Home Financials for this Owner
Home Financials are based on the most recent Mortgage that was taken out on this home.
Original Mortgage
$184,500
Outstanding Balance
$161,329
Interest Rate
3.65%
Estimated Equity
$93,387
Purchase Details
Closed on
Dec 20, 2018
Sold by
Preston Amanda
Bought by
Brock Tim
Purchase Details
Closed on
Mar 2, 2007
Sold by
Kidd Amanda Y
Bought by
Preston Amanda Y
Purchase Details
Closed on
Mar 11, 2003
Sold by
Yencha Kathleen S and Amanda Kid
Bought by
Kidd Amanda
Purchase Details
Closed on
Jan 29, 2002
Sold by
Yencha Kathleen S
Bought by
Yencha Kathleen S and Amanda Kidd
Purchase Details
Closed on
Jun 23, 1980
Bought by
Yencha Kathleen S
Create a Home Valuation Report for This Property
The Home Valuation Report is an in-depth analysis detailing your home's value as well as a comparison with similar homes in the area
Home Values in the Area
Average Home Value in this Area
Purchase History
| Date | Buyer | Sale Price | Title Company |
|---|---|---|---|
| Jakson James Bradley | -- | -- | |
| Jakson James Bradley | $184,500 | -- | |
| Brock Tim | $58,000 | -- | |
| Preston Amanda Y | -- | -- | |
| Kidd Amanda | -- | -- | |
| Yencha Kathleen S | -- | -- | |
| Yencha Kathleen S | -- | -- |
Source: Public Records
Mortgage History
| Date | Status | Borrower | Loan Amount |
|---|---|---|---|
| Open | Jakson James Bradley | $184,500 | |
| Closed | Jakson James Bradley | $184,500 |
Source: Public Records
Tax History Compared to Growth
Tax History
| Year | Tax Paid | Tax Assessment Tax Assessment Total Assessment is a certain percentage of the fair market value that is determined by local assessors to be the total taxable value of land and additions on the property. | Land | Improvement |
|---|---|---|---|---|
| 2024 | $3,371 | $115,892 | $1,600 | $114,292 |
| 2023 | $3,371 | $105,471 | $1,600 | $103,871 |
| 2022 | $2,751 | $84,954 | $1,600 | $83,354 |
| 2021 | $2,432 | $72,934 | $1,600 | $71,334 |
| 2020 | $2,163 | $64,355 | $1,600 | $62,755 |
| 2019 | $791 | $32,458 | $1,600 | $30,858 |
| 2018 | $363 | $28,558 | $1,600 | $26,958 |
| 2017 | $365 | $28,558 | $1,600 | $26,958 |
| 2016 | $417 | $28,558 | $1,600 | $26,958 |
| 2015 | $531 | $35,190 | $6,000 | $29,190 |
| 2014 | $535 | $35,190 | $6,000 | $29,190 |
Source: Public Records
Map
Nearby Homes
- 434 Sally Ann Cir
- 430 Sally Ann Cir
- 415 Sally Ann Cir
- 424 Sally Ann Cir
- 425 Sally Ann Cir
- 422 Sally Ann Cir
- 409 Sally Ann Cir
- 444 Sally Ann Cir
- 444 Sally Ann Cir
- 440 Sally Ann Cir
- 447 Sally Ann Cir
- 406 Sally Ann Cir
- 405 Sally Ann Cir
- 448 Sally Ann Cir
- 446 Sally Ann Cir
- 457 Sally Ann Cir
- 340 Tarpley Ave
- 406 Tarpley Ave
- 403 Sally Ann Cir
- 450 Sally Ann Cir