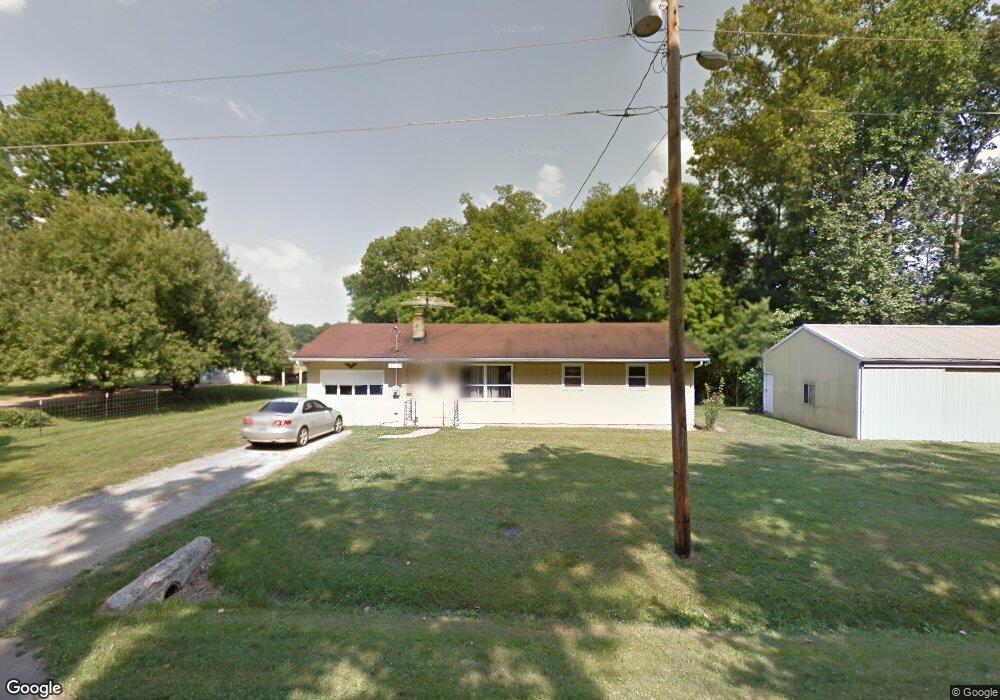
4320 Anderson Rd Morrow, OH 45152
Estimated Value: $214,000 - $238,312
3
Beds
1
Bath
1,404
Sq Ft
$163/Sq Ft
Est. Value
About This Home
This home is located at 4320 Anderson Rd, Morrow, OH 45152 and is currently estimated at $228,578, approximately $162 per square foot. 4320 Anderson Rd is a home located in Warren County with nearby schools including Little Miami Early Childhood Center, Little Miami Intermediate Middle School, and Little Miami Middle School.
Ownership History
Date
Name
Owned For
Owner Type
Purchase Details
Closed on
Dec 21, 2023
Sold by
Kilburn Christopher W and Kilburn Brittany
Bought by
Kilburn Christopher W and Hennel Brittany
Current Estimated Value
Home Financials for this Owner
Home Financials are based on the most recent Mortgage that was taken out on this home.
Original Mortgage
$187,220
Outstanding Balance
$183,430
Interest Rate
7.44%
Mortgage Type
FHA
Estimated Equity
$45,148
Purchase Details
Closed on
Jul 9, 2013
Sold by
Jackson Michelle R
Bought by
Kilburn Christopher W
Home Financials for this Owner
Home Financials are based on the most recent Mortgage that was taken out on this home.
Original Mortgage
$90,000
Interest Rate
3.83%
Mortgage Type
Future Advance Clause Open End Mortgage
Purchase Details
Closed on
Mar 5, 1993
Sold by
Lehman Ward J and Lehman Tam
Bought by
Lehman and Lehman Marvin D
Purchase Details
Closed on
Jul 5, 1989
Sold by
Lehman Ward Junior and Ward Junior
Bought by
Lehman and Lehman Ward J
Create a Home Valuation Report for This Property
The Home Valuation Report is an in-depth analysis detailing your home's value as well as a comparison with similar homes in the area
Home Values in the Area
Average Home Value in this Area
Purchase History
We collect this data history from publicly available records. To have your information removed, we recommend requesting removal directly through your county’s website.
| Date | Buyer | Sale Price | Title Company |
|---|---|---|---|
| Kilburn Christopher W | -- | None Listed On Document | |
| Kilburn Christopher W | $85,000 | None Available | |
| Lehman | -- | -- | |
| Lehman | -- | -- |
Source: Public Records
Mortgage History
We collect this data history from publicly available records. To have your information removed, we recommend requesting removal directly through your county’s website.
| Date | Status | Borrower | Loan Amount |
|---|---|---|---|
| Open | Kilburn Christopher W | $187,220 | |
| Previous Owner | Kilburn Christopher W | $90,000 |
Source: Public Records
Tax History
| Year | Tax Paid | Tax Assessment Tax Assessment Total Assessment is a certain percentage of the fair market value that is determined by local assessors to be the total taxable value of land and additions on the property. | Land | Improvement |
|---|---|---|---|---|
| 2025 | $2,748 | $59,560 | $19,590 | $39,970 |
| 2024 | $2,748 | $59,560 | $19,590 | $39,970 |
| 2023 | $2,517 | $48,608 | $13,405 | $35,203 |
| 2022 | $2,491 | $48,608 | $13,405 | $35,203 |
| 2021 | $2,379 | $48,608 | $13,405 | $35,203 |
| 2020 | $2,330 | $40,509 | $11,172 | $29,337 |
| 2019 | $2,371 | $40,509 | $11,172 | $29,337 |
| 2018 | $2,411 | $40,509 | $11,172 | $29,337 |
| 2017 | $2,230 | $36,698 | $10,217 | $26,481 |
| 2016 | $2,276 | $36,698 | $10,217 | $26,481 |
| 2015 | $2,136 | $36,698 | $10,217 | $26,481 |
| 2014 | $2,171 | $33,410 | $9,340 | $24,070 |
| 2013 | $2,079 | $39,850 | $11,060 | $28,790 |
Source: Public Records
Map
Nearby Homes
- 5323 U S 22
- 5323 US Rt 22 & 3
- 465 E Pike St
- 5267 Radford Dr
- 5184 Pinecrest Dr
- 102 Hazen Ave
- 5777 U S 22
- 113 Kibbey Ave
- 5834 Lake Rd
- 5827 Lake Rd
- 4956 Jessica Suzanne Dr
- 4984 Mary Louise Ct
- 3155 Rosemary Ct Unit Lot 94
- 3155 Rosemary Ct
- 5195 Lucy James Ct
- 6491 Cooper Grace Ln
- 5023 Mary Louise Ct
- 6136 Main St
- 5670 Julia Kate Dr
- 5678 Julia Kate Dr
- 4296 Anderson Rd
- 4352 Anderson Rd
- 4264 Anderson Rd
- 4283 Anderson Rd
- 4407 Anderson Rd
- 4265 Anderson Rd
- 4451 Anderson Rd
- 4219 Anderson Rd
- 4118 Anderson Rd
- 4212 Anderson Rd
- 4187 Anderson Rd
- 4131 Anderson Rd
- 4998 Mason Morrow Millgrove Rd
- 4091 Anderson Rd
- 5000 Mason Morrow Millgrove Rd
- 4047 Anderson Rd
- 4996 Mason Morrow Millgrove Rd
- 5015 Masn Morrow Millgrove Rd
- 4935 Mason Morrow Millgrove Rd
- 5001 Masn Morrow Millgrove Rd
Your Personal Tour Guide
Ask me questions while you tour the home.