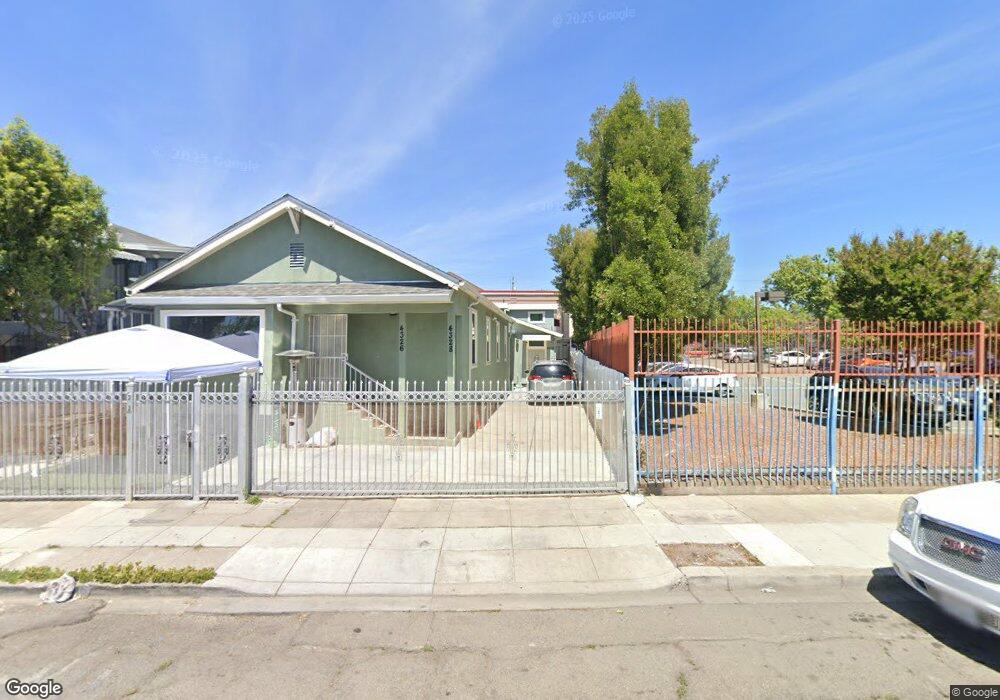
4320 Bond St Oakland, CA 94601
Fremont NeighborhoodEstimated Value: $581,000 - $679,000
4
Beds
3
Baths
2,138
Sq Ft
$289/Sq Ft
Est. Value
About This Home
This home is located at 4320 Bond St, Oakland, CA 94601 and is currently estimated at $618,000, approximately $289 per square foot. 4320 Bond St is a home located in Alameda County with nearby schools including Horace Mann Elementary School, Urban Promise Academy, and United For Success Academy.
Ownership History
Date
Name
Owned For
Owner Type
Purchase Details
Closed on
Apr 9, 2019
Sold by
Ceo America Llc
Bought by
Ho Sao Chan
Current Estimated Value
Purchase Details
Closed on
Oct 19, 2018
Sold by
Williams Elsie M
Bought by
Ceo America Llc
Purchase Details
Closed on
Jul 23, 2009
Sold by
Williams Elsie M
Bought by
Williams Elsie Marie
Purchase Details
Closed on
Dec 6, 1994
Sold by
Williams Elsie M
Bought by
Williams Elsie M and Williams Kenneth Wade
Create a Home Valuation Report for This Property
The Home Valuation Report is an in-depth analysis detailing your home's value as well as a comparison with similar homes in the area
Home Values in the Area
Average Home Value in this Area
Purchase History
| Date | Buyer | Sale Price | Title Company |
|---|---|---|---|
| Ho Sao Chan | $290,000 | Chicago Title Company | |
| Ceo America Llc | $297,000 | First American Title | |
| Williams Elsie Marie | -- | None Available | |
| Williams Elsie M | -- | -- |
Source: Public Records
Tax History Compared to Growth
Tax History
| Year | Tax Paid | Tax Assessment Tax Assessment Total Assessment is a certain percentage of the fair market value that is determined by local assessors to be the total taxable value of land and additions on the property. | Land | Improvement |
|---|---|---|---|---|
| 2025 | $8,810 | $558,020 | $129,398 | $428,622 |
| 2024 | $8,810 | $547,081 | $126,861 | $420,220 |
| 2023 | $9,206 | $536,355 | $124,374 | $411,981 |
| 2022 | $8,000 | $459,838 | $121,935 | $337,903 |
| 2021 | $5,523 | $298,861 | $119,544 | $179,317 |
| 2020 | $5,461 | $295,800 | $118,320 | $177,480 |
| 2019 | $6,435 | $380,000 | $152,000 | $228,000 |
| 2018 | $3,513 | $140,236 | $42,071 | $98,165 |
| 2017 | $2,884 | $137,487 | $41,246 | $96,241 |
| 2016 | $2,391 | $134,791 | $40,437 | $94,354 |
| 2015 | $2,687 | $132,767 | $39,830 | $92,937 |
| 2014 | $2,616 | $130,167 | $39,050 | $91,117 |
Source: Public Records
Map
Nearby Homes
- 1718 High St
- 1430 45th Ave
- 1620 46th Ave
- 4114 E 17th St
- 4709 Foothill Blvd
- 1211 41st Ave
- 1205 41st Ave
- 1434 47th Ave
- 1507 48th Ave
- 1818 Rosedale Ave
- 4037 E 16th St
- 1631 Rosedale Ave
- 2123 High St
- 2162 45th Ave
- 4010 Foothill Blvd
- 2105 48th Ave
- 1433 50th Ave
- 2042 Rosedale Ave
- 2158 High St
- 1201 41st Ave
- 1724 High St
- 4411 Foothill Blvd
- 4425 Foothill Blvd
- 1723 High St
- 1640 45th Ave
- 4510 Bond St
- 4505 Bond St
- 1715 High St
- 1715 High St Unit 109
- 1715 High St Unit 306
- 1715 High St Unit 105
- 1715 High St Unit 307
- 1715 High St Unit 103
- 1715 High St Unit 204
- 1624 45th Ave
- 4516 Bond St
- 4507 Bond St
- 4515 Bond St
- 4237 Foothill Blvd Unit 4239C
- 4237 Foothill Blvd