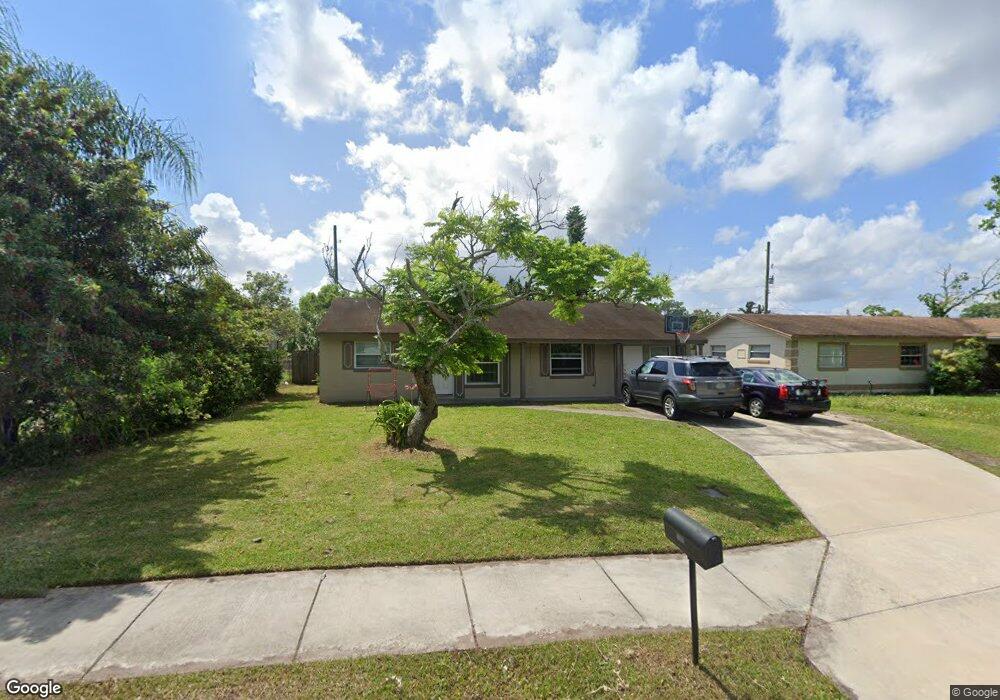
4320 Walbridge St Orlando, FL 32809
Estimated Value: $308,000 - $341,000
3
Beds
2
Baths
1,523
Sq Ft
$216/Sq Ft
Est. Value
About This Home
This home is located at 4320 Walbridge St, Orlando, FL 32809 and is currently estimated at $329,361, approximately $216 per square foot. 4320 Walbridge St is a home located in Orange County with nearby schools including Sadler Elementary School, Dr. Phillips High School, and Westridge Middle School.
Ownership History
Date
Name
Owned For
Owner Type
Purchase Details
Closed on
Dec 19, 2014
Sold by
Fetlar Llc
Bought by
Sway 2014-1 Borrower Llc
Current Estimated Value
Home Financials for this Owner
Home Financials are based on the most recent Mortgage that was taken out on this home.
Original Mortgage
$531,049,000
Outstanding Balance
$400,131,068
Interest Rate
4.03%
Mortgage Type
Purchase Money Mortgage
Estimated Equity
-$399,801,707
Purchase Details
Closed on
Jul 23, 2013
Sold by
Bueno Elna and Santana Ramon
Bought by
Srp Sub Llc
Purchase Details
Closed on
May 2, 2002
Sold by
Frankie L Carr M and Sherry L Carr M
Bought by
Bueno Elina and Santana Ramon
Home Financials for this Owner
Home Financials are based on the most recent Mortgage that was taken out on this home.
Original Mortgage
$108,300
Interest Rate
7.16%
Mortgage Type
FHA
Create a Home Valuation Report for This Property
The Home Valuation Report is an in-depth analysis detailing your home's value as well as a comparison with similar homes in the area
Home Values in the Area
Average Home Value in this Area
Purchase History
We collect this data history from publicly available records. To have your information removed, we recommend requesting removal directly through your county’s website.
| Date | Buyer | Sale Price | Title Company |
|---|---|---|---|
| Sway 2014-1 Borrower Llc | -- | None Available | |
| Srp Sub Llc | $63,600 | None Available | |
| Bueno Elina | $110,000 | -- |
Source: Public Records
Mortgage History
We collect this data history from publicly available records. To have your information removed, we recommend requesting removal directly through your county’s website.
| Date | Status | Borrower | Loan Amount |
|---|---|---|---|
| Open | Sway 2014-1 Borrower Llc | $531,049,000 | |
| Previous Owner | Bueno Elina | $108,300 |
Source: Public Records
Tax History
| Year | Tax Paid | Tax Assessment Tax Assessment Total Assessment is a certain percentage of the fair market value that is determined by local assessors to be the total taxable value of land and additions on the property. | Land | Improvement |
|---|---|---|---|---|
| 2025 | $3,570 | $191,304 | -- | -- |
| 2024 | $2,993 | $173,913 | -- | -- |
| 2023 | $2,993 | $217,554 | $75,000 | $142,554 |
| 2022 | $2,568 | $173,354 | $60,000 | $113,354 |
| 2021 | $2,274 | $139,685 | $45,000 | $94,685 |
| 2020 | $2,090 | $138,094 | $40,000 | $98,094 |
| 2019 | $1,996 | $125,181 | $35,000 | $90,181 |
| 2018 | $1,863 | $114,362 | $25,000 | $89,362 |
| 2017 | $1,551 | $80,965 | $20,000 | $60,965 |
| 2016 | $1,425 | $72,048 | $15,000 | $57,048 |
| 2015 | $1,364 | $66,769 | $15,000 | $51,769 |
| 2014 | $1,333 | $61,963 | $15,000 | $46,963 |
Source: Public Records
Map
Nearby Homes
- 4401 Edgebrook Dr
- 6027 Wilbeth Ave
- 6305 Hillwood Dr
- 5828 Harcourt Ave
- 5801 Brookgreen Ave
- 4006 Macdonough Ave
- 6122 Burhley Ct
- 4026 Seabridge Dr Unit 3
- 5579 Millenia Blvd Unit 319
- 5587 Millenia Blvd Unit 207
- 4052 Castlegate Dr
- 4048 Castlegate Dr
- 4034 Castlegate Dr
- 4067 Kingsport Dr
- 5526 Pga Blvd Unit 4913
- 5526 Pga Blvd Unit 4927
- 5579 Millenia Park Blvd Unit 521
- 5579 Millenia Park Blvd Unit 110
- 7304 Pomelo Dr
- 5501 Pga Blvd Unit 4724
- 4323 Edgebrook Dr
- 4405 Edgebrook Dr
- 4402 Walbridge St
- 4409 Edgebrook Dr
- 4319 Edgebrook Dr
- 4324 Walbridge St
- 4406 Walbridge St
- 4322 Edgebrook Dr
- 4400 Edgebrook Dr
- 4318 Edgebrook Dr
- 4413 Edgebrook Dr
- 4404 Edgebrook Dr
- 4315 Edgebrook Dr
- 4410 Walbridge St
- 4314 Edgebrook Dr
- 4408 Edgebrook Dr
- 4316 Walbridge St
- 4417 Edgebrook Dr
- 4414 Walbridge St
- 4311 Edgebrook Dr
Your Personal Tour Guide
Ask me questions while you tour the home.