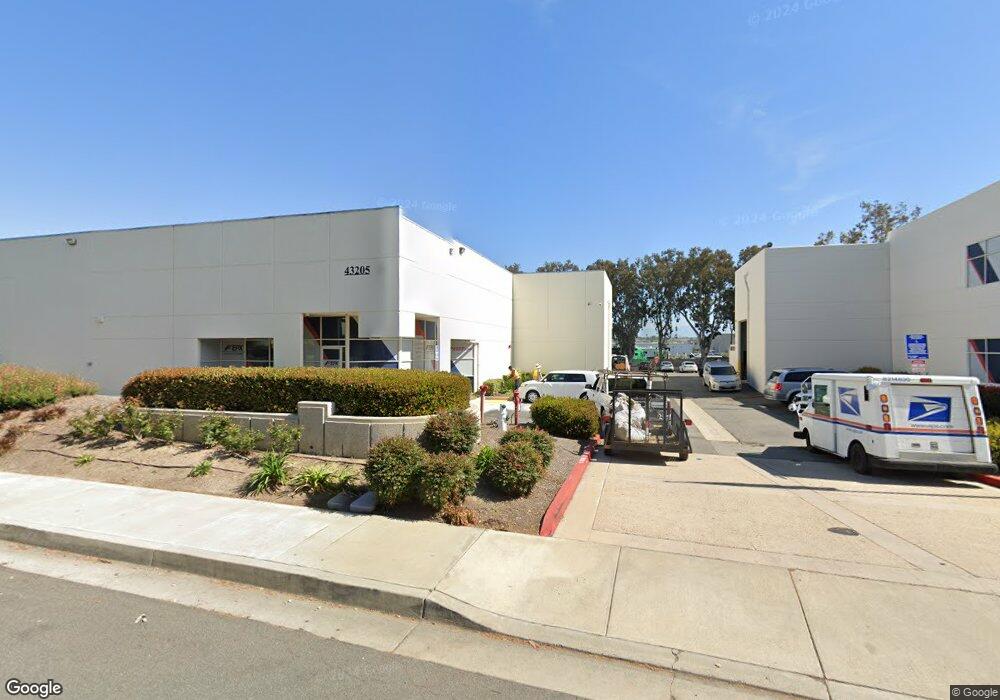
43205 Business Park Dr Temecula, CA 92590
Estimated Value: $1,922,181
--
Bed
--
Bath
7,474
Sq Ft
$257/Sq Ft
Est. Value
About This Home
This home is located at 43205 Business Park Dr, Temecula, CA 92590 and is currently estimated at $1,922,181, approximately $257 per square foot. 43205 Business Park Dr is a home located in Riverside County with nearby schools including Vail Elementary School, Margarita Middle School, and Temecula Valley High School.
Ownership History
Date
Name
Owned For
Owner Type
Purchase Details
Closed on
Aug 3, 2020
Sold by
Business Park Drive Llc
Bought by
Cmax Properties Llc
Current Estimated Value
Home Financials for this Owner
Home Financials are based on the most recent Mortgage that was taken out on this home.
Original Mortgage
$682,300
Outstanding Balance
$606,366
Interest Rate
3.1%
Mortgage Type
Purchase Money Mortgage
Estimated Equity
$1,315,815
Purchase Details
Closed on
Sep 13, 2016
Sold by
Stanton Robert Q and Stanton Marie H
Bought by
Business Park Drive Llc
Purchase Details
Closed on
Jan 14, 1994
Sold by
Sbs Realty Inc
Bought by
Stanton Robert Q and Stanton Marie H
Create a Home Valuation Report for This Property
The Home Valuation Report is an in-depth analysis detailing your home's value as well as a comparison with similar homes in the area
Home Values in the Area
Average Home Value in this Area
Purchase History
| Date | Buyer | Sale Price | Title Company |
|---|---|---|---|
| Cmax Properties Llc | $1,341,500 | Chicago Title Company | |
| Business Park Drive Llc | $820,000 | Chicago Title Inland Empire | |
| Stanton Robert Q | $350,000 | First American Title Ins Co |
Source: Public Records
Mortgage History
| Date | Status | Borrower | Loan Amount |
|---|---|---|---|
| Open | Cmax Properties Llc | $682,300 |
Source: Public Records
Tax History Compared to Growth
Tax History
| Year | Tax Paid | Tax Assessment Tax Assessment Total Assessment is a certain percentage of the fair market value that is determined by local assessors to be the total taxable value of land and additions on the property. | Land | Improvement |
|---|---|---|---|---|
| 2025 | $16,427 | $1,451,885 | $508,742 | $943,143 |
| 2023 | $16,427 | $1,395,508 | $488,988 | $906,520 |
| 2022 | $15,959 | $1,368,146 | $479,400 | $888,746 |
| 2021 | $15,658 | $1,341,320 | $470,000 | $871,320 |
| 2020 | $9,782 | $870,190 | $148,569 | $721,621 |
| 2019 | $9,642 | $853,128 | $145,656 | $707,472 |
| 2018 | $9,468 | $836,400 | $142,800 | $693,600 |
| 2017 | $9,306 | $820,000 | $140,000 | $680,000 |
| 2016 | $6,187 | $502,503 | $215,357 | $287,146 |
| 2015 | $6,086 | $494,957 | $212,123 | $282,834 |
| 2014 | $5,918 | $485,264 | $207,969 | $277,295 |
Source: Public Records
Map
Nearby Homes
- 28180 Jefferson Ave
- 42961 Avenida Amistad
- 42945 Avenida Amistad
- 42921 Avenida Amistad
- 29503 Cara Way
- 29496 Courtney Place
- 29548 Courtney Place
- 29581 Cara Way
- 42140 Lyndie Ln Unit 24
- 42140 Lyndie Ln Unit 4
- 29606 Cara Way
- 42944 Calle Reva
- 42045 3rd St
- 29634 Ramsey Ct
- 15 Camino Gatillo
- 28282 Sycamore Mesa Rd
- 43882 Butternut Dr
- 42086 Paseo Brillante
- 42107 Paseo Rayo Del Sol
- 41841 Saint Thomas Ct
- 43223 Business Park Dr
- 43357 Business Park Dr Unit 103
- 43154 Via Dos Picos
- 43191 Rancho Way
- 43071 Business Park Dr
- 43122 Vía Dos Picos Unit C
- 43119 Via Dos Picos
- 0 Business Park Unit T08046779
- 0 Business Park Unit 150051071
- 0 Business Park Unit 170001434
- 43094 Via Dos Picos
- 27731 Diaz Rd
- 43379 Business Park Dr
- 43385 Business Park Dr
- 43385 Business Park Dr Unit 210
- 43385 Business Park Dr Unit 200
- 43385 Business Park Dr Unit 140
- 43136 Rancho Way
- 43250 Business Park Dr
- 43250 Business Park Dr Unit 104